Are you struggling to keep track of the performance of your Google Ads campaigns because of limited visibility into key metrics? And are you finding it frustrating to spend hours manually creating reports, taking valuable time away from other important tasks?
This could be handled by using the Google Ads Account Summary Report script, which automatically generates reports on a daily, weekly, or monthly basis to provide insights into important metrics such as impressions, clicks, cost, and conversion rates and improve your ability to manage and optimize your Google Ads campaigns effectively.
Before setting up the script, get familiar with the interface and navigation in Google ads.

- Tools- The Tools tab provides direct links to various Google Ads account tools. Use these tools to monitor and make changes to your account, ads, ad groups, and keywords.
- Bulk actions- It allows advertisers to modify multiple campaigns, ad groups, ads, or keywords in a single action, saving time and effort.
- Scripts- It allows advertisers to automate and customize their bulk actions. This tool allows advertisers to create custom scripts that perform specific actions on their campaigns or accounts, such as updating bids, pausing underperforming ads, or adding new keywords.
- + button- It allows advertisers to create new scripts.

- New Script- It allows advertisers to create a new script from scratch.

- Add Script Name- It allows advertisers to name their scripts.

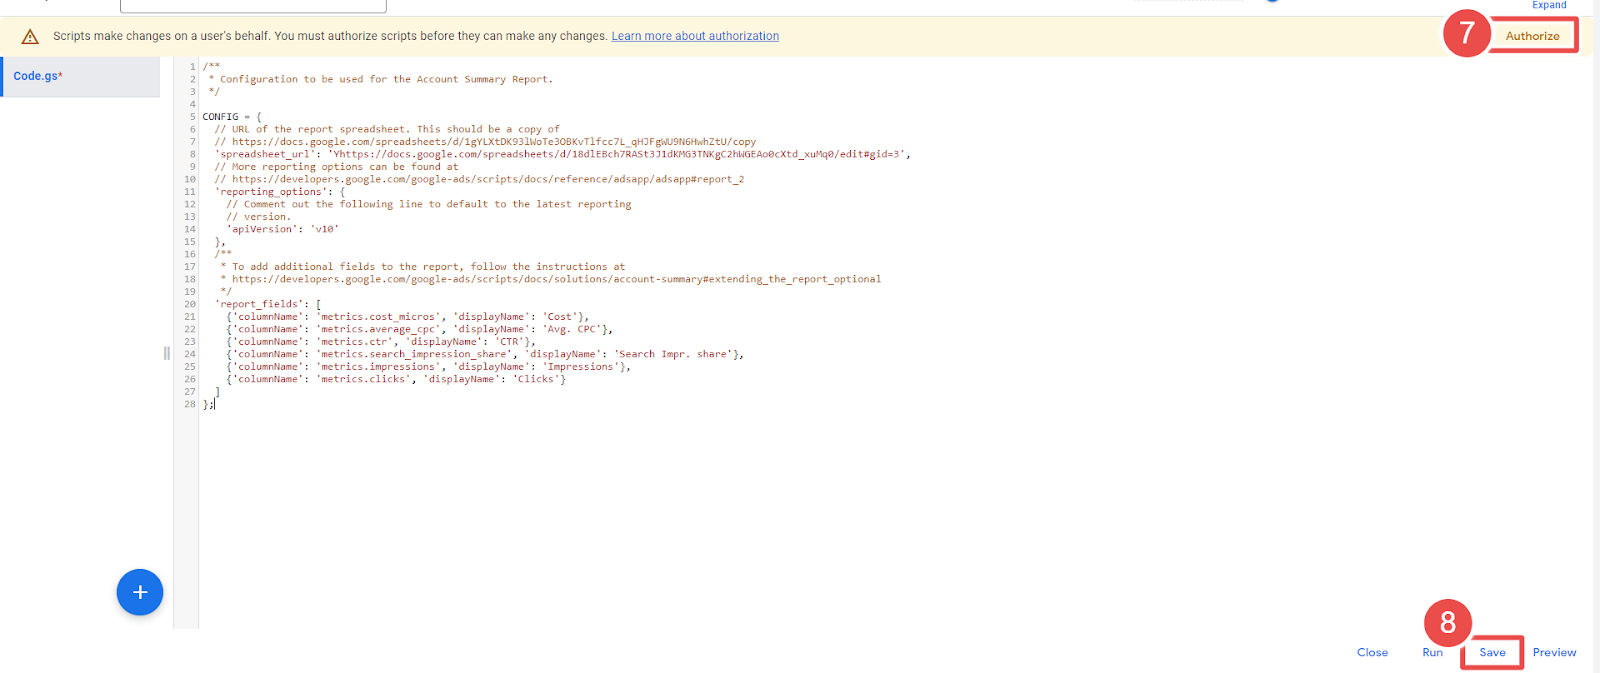
- Authorize- It allows advertisers to grant permission for their script to access their Google Ads account.
- Save- It allows advertisers to save their scripts after making changes or creating new ones.

- Frequency- It allows advertisers to set how often a script runs.
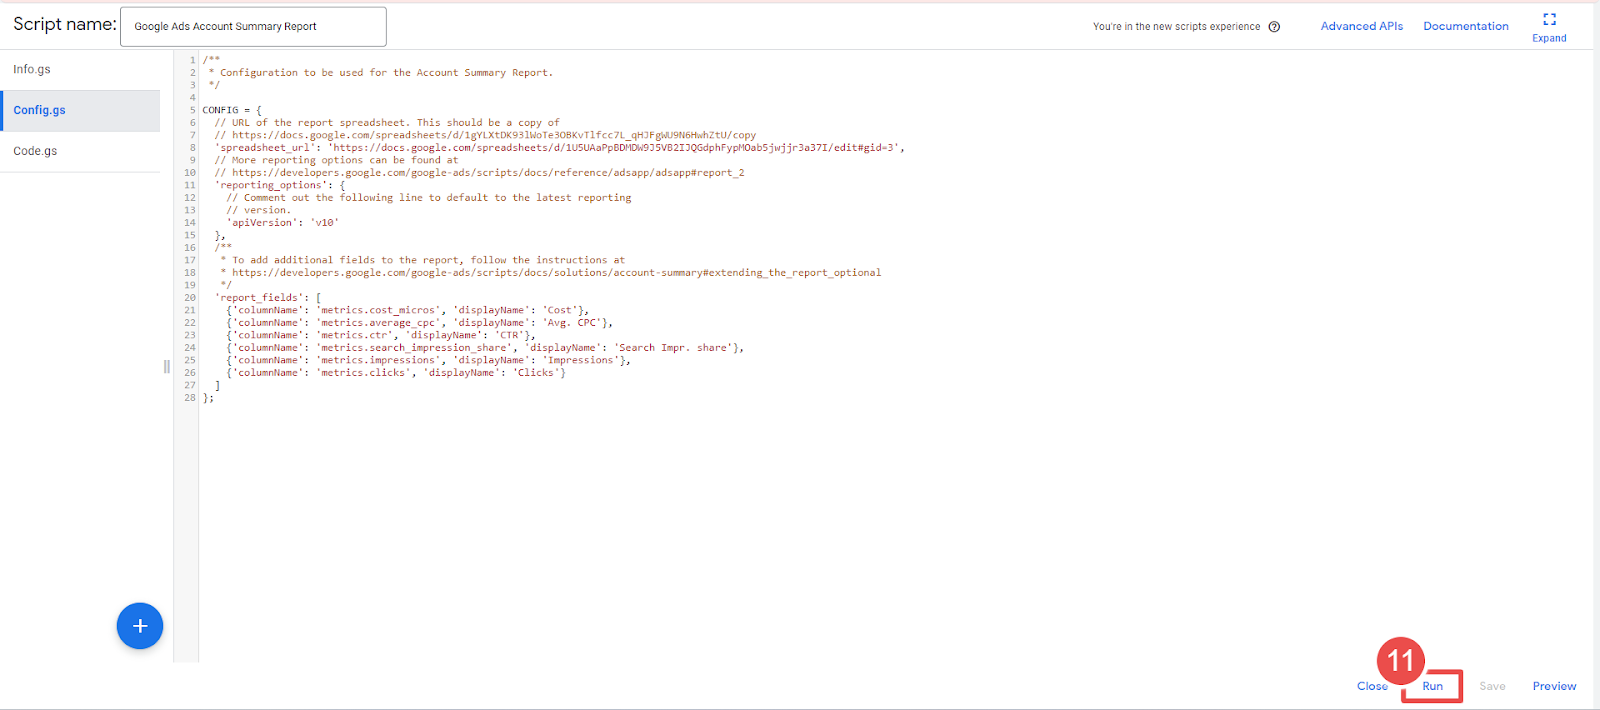
- Script - Given script name is Google Ads Account Summary Report.

- Run- It allows advertisers to execute a script.


- Logs- The log statement in Google Ads Script Tools is used to output messages to the script's log, helping advertisers track progress, troubleshoot issues, and create custom reports.
A step-by-step guide on using the Google Ads Account Summary Report script:
Step-1 Sign in to your Google Ads account.
Step-2 Click on the "Tools & Settings"
Step-3 Select Scripts under BULK ACTIONS.
Step-4 Click on the "plus" button to create a new script.
Step-5 Name your script and Copy and paste the spreadsheet-based script.
Step-6 Next, make a copy of the given template spreadsheet. (enter the valid email address to the spreadsheet)
Step-7 Update spreadsheet_url in your script with the URL of the copied spreadsheet.
Step-8 Customize to include the specific metrics you want to track, such as impressions, clicks, cost, conversion rates, etc.
Step-9 Click the "Authorize" button to authorize the script to access your account.
Step-10 Click on the "Save" button.
Step-11 Go back to the "Scripts" section and set the report frequency to be generated (Schedule the script to run Daily, 3 am)
Step-12 Then click on Google Ads Account Summary Report.
Step- 13 Next, run it to generate the report.
Once you've set up the script, it will automatically generate and send the report to your specified email address on your chosen frequency. You can then use this report to gain valuable insights into the performance of your Google Ads campaigns and make data-driven decisions to optimize your advertising efforts.
Extending the report is optional, and it allows you to add metrics beyond those available in the basic template. Here's how to do it:
Step-1 Add a heading for the new metric you want to add to your spreadsheet in the next available column.
Step- 2 Edit the REPORT_FIELDS definition near the top of the script to include the new metric. For example, if you want to add Search Impression Share, you would add the following line to the definition:
var REPORT_FIELDS = [
{columnName: 'metrics.cost_micros', displayName: 'Cost'},
{columnName: 'metrics.average_cpc', displayName: 'Average CPC'},
{columnName: 'metrics.ctr', displayName: 'CTR'},
{columnName: 'metrics.impression', displayName: 'Impressions'},
{columnName: 'metrics.clicks', displayName: 'Clicks'},
{columnName: 'metrics.search_impression-share', displayName: 'Search Imp. Share'}
];
*You can choose any value for the displayName parameter, which will be used as the heading for the new metric in the report email.
Step-3 Save the script and run it to generate the report with the new metric included.
To create a chart for the new metric:
- Click on one of the existing charts in your spreadsheet.
- Under the three dots menu in the top right of the chart, select "Copy Chart."
- Right-click and select "Paste" to create a new chart on the sheet.
- On the menu for the new chart, select "Edit Chart."
- Change the series column reference to the column containing the new data.
- Double-click on the chart title and change it to the name of the new metric.
With these steps, you can easily extend the report to include additional metrics and create charts to visualize the data.


