Have you ever found it challenging to analyze large datasets? If so, do you struggle to identify important trends within the data quickly?
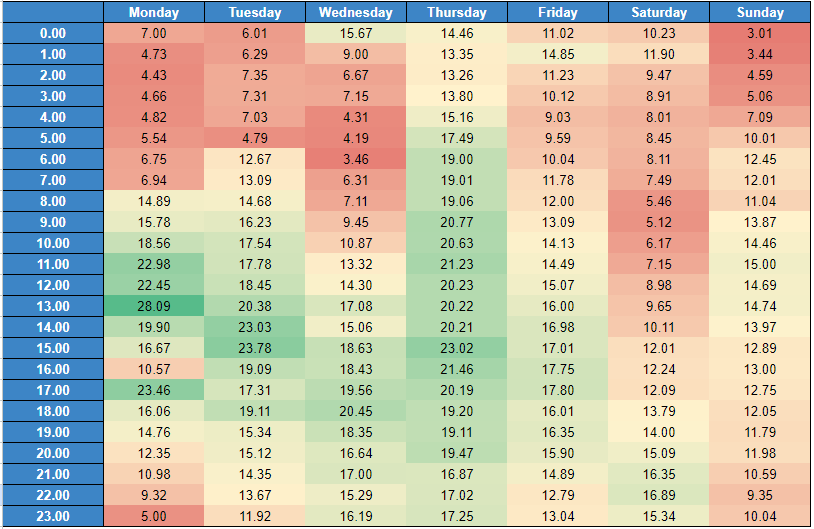
Heat maps are a helpful tool for visualizing patterns in data, particularly when analyzing performance changes over time. If you have a lot of data, it can be difficult to understand what it all means just by looking at a table of numbers. Heat maps can make it easier by showing you the data on a grid with different colors for different values. This lets you see patterns and relationships in your data more easily. Heat maps are especially useful if you want to analyze data over multiple days and hours, as they show you how performance changes over time clearly and simply.
Before setting up the script, get familiar with the interface and navigation in Google ads.
- Tools- The Tools tab provides direct links to various Google Ads account tools. Use these tools to monitor and make changes to your account, ads, ad groups, and keywords.
- Bulk actions- It allows advertisers to modify multiple campaigns, ad groups, ads, or keywords in a single action, saving time and effort.
- Scripts- It allows advertisers to automate and customize their bulk actions. This tool allows advertisers to create custom scripts that perform specific actions on their campaigns or accounts, such as updating bids, pausing underperforming ads, or adding new keywords.
- + button- It allows advertisers to create new scripts.
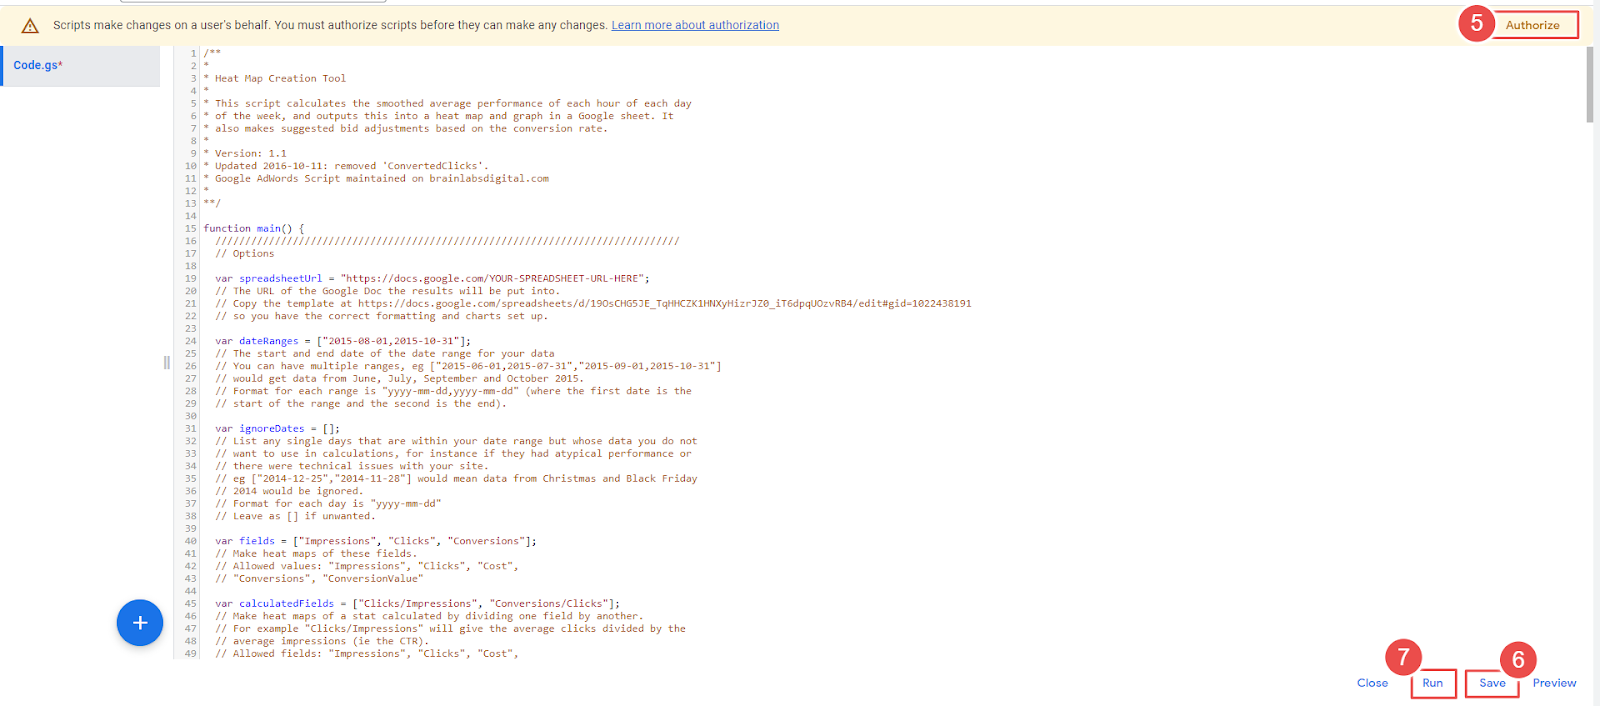
- Authorize- It allows advertisers to grant permission for their script to access their Google Ads account.
- Save- It allows advertisers to save their scripts after making changes or creating new ones.
- Run- It allows advertisers to execute a script manually.
How to use the script-
Step-1 Log in to your Google Ads account.
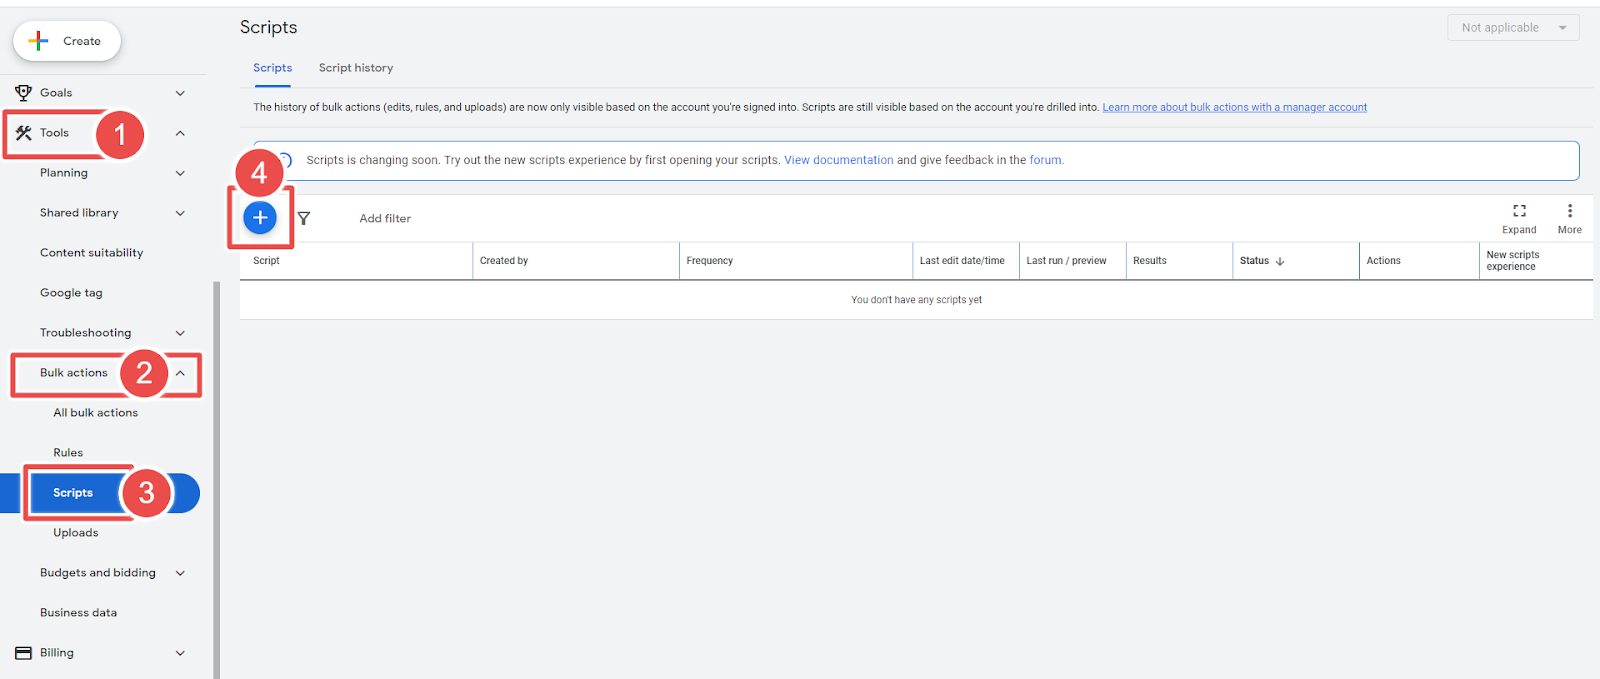
Step-2 Click the Tools icon and select Scripts under BULK ACTIONS.
Step-3 Click the "+ Script" button to create a new script.
Step-4 To use and add the script correctly, to create your own heatmap using the template provided, you need to follow these steps:
- Make a copy of the document in your google drive account.
- The formatting is already set up for you, so you don't need to worry about that.
- If needed, you can change the locale in the File menu and Spreadsheet Settings. This will affect how numbers are formatted, such as whether a dot or comma is used as the decimal mark.
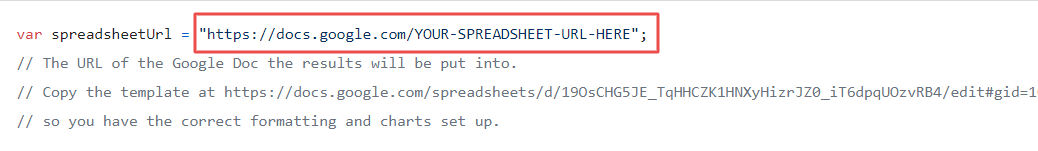
Once you have made a copy of the document, the next step is to enter the script into your AdWords account and configure the following parameters:
- SPREADSHEETURL: It is the URL of the copy of the document you have on your Google Drive. This is where your heat maps will end up.
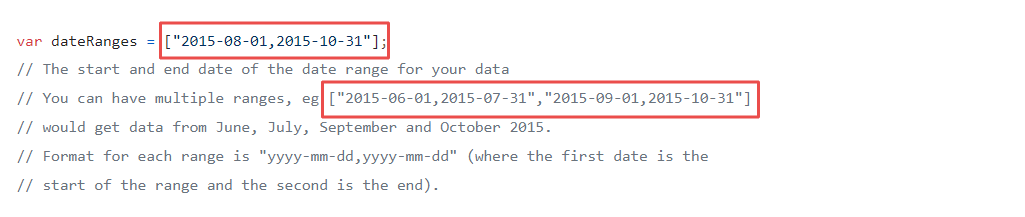
- DateRanges: The "dateRanges" option allows you to select the dates that you want to extract data from. You can give multiple date ranges. Each date range uses the format “yyyy-mm-dd, yyyy-mm-dd.”
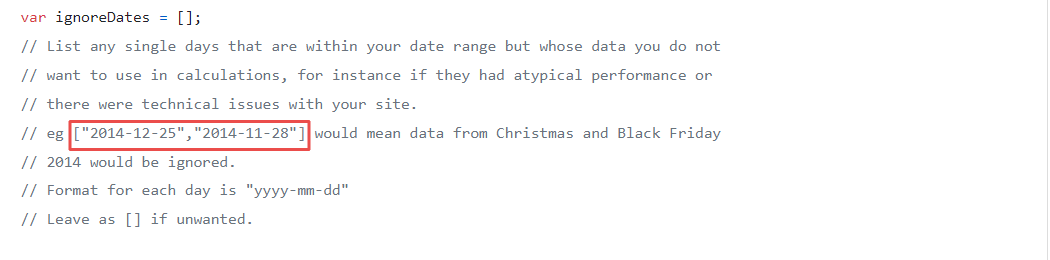
- IgnoreDates: You can use this to exclude data from particular dates. This is a comma-separated list of dates in the “yyyy-mm-dd” format.
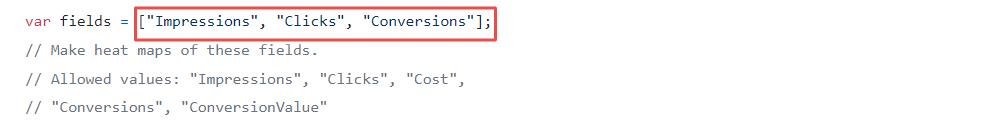
- Fields: Here, we will indicate the different fields that we want to calculate.
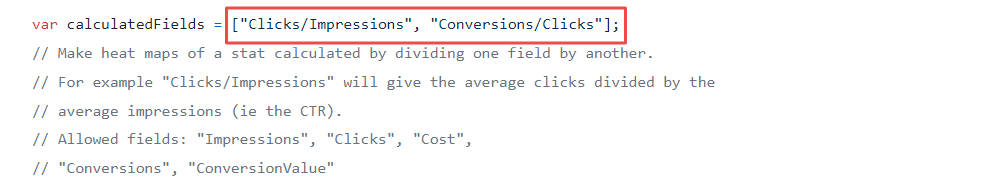
- Calculated fields: It is used when there are metrics that cannot be simply added together or averaged to calculate a particular value.
An example of this is the "Click-through Rate" (CTR), which cannot be obtained by summing up the CTRs of each hour of each day. Instead, the CTR must be calculated from the clicks and impressions data after being averaged and smoothed.This is a comma-separated list, in quotes, of one field divided by another. For example, “Clicks/Impressions” (to give the CTR) and “ConvertedClicks/Clicks” (to get the click conversion rate).
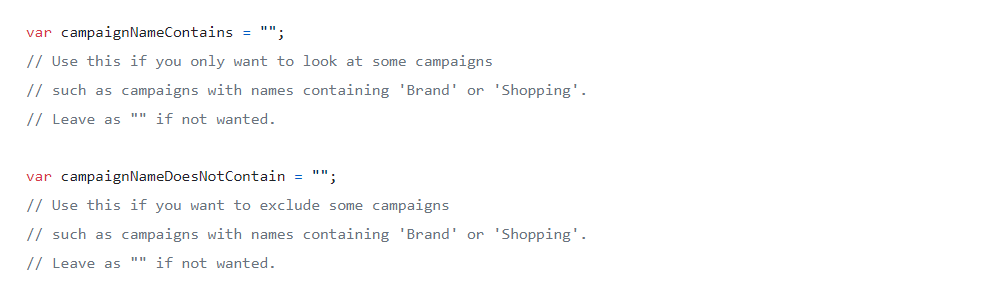
- CampaignNameContains and campaignNameDoesNotContain: These features are used to filter campaigns based on specific text in their names. For instance, a user can use "CampaignNameContains" to only view campaigns with "Shopping" in their name or use "CampaignNameDoesNotContain" to exclude campaigns with "Brand" in their name. These features enable users to quickly focus on campaigns relevant to their analysis and ignore those not.
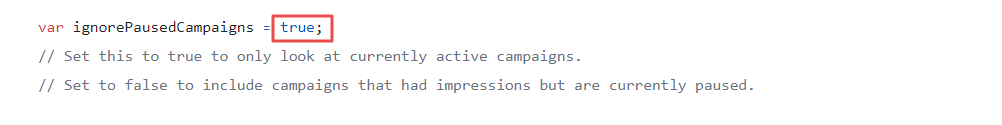
- IgnorePausedCampaigns: It helps to filter campaigns based on their current status. You can set it to true if you only want to see currently running campaigns. If you want to view all campaigns, including those temporarily paused, set it to false. Regardless of this setting, any campaigns that have been removed will always be excluded from your analysis.
Step-5 After making the changes, you can authorize, save and run the script.
Step-6 Once the script has finished running. You will have the first heat map of your AdWords account.