
When your marketing, sales, and revenue teams aren’t aligned, it’s not always because of strategy or effort. It’s often because no one’s looking at the same data.
As a GTM leader, you’re expected to spot pipeline risks before they happen, justify budgets with confidence, and keep everyone focused on what matters. But you can’t do that with scattered spreadsheets or reports no one reads.
You need reporting that’s trusted, up-to-date, and actually drives decisions.
Below are six reports that every GTM leader should rely on to stay ahead, move faster, and align teams across the funnel. Each one gives you a different angle of visibility, and together, they build a complete GTM command center.
1. Executive Scorecard
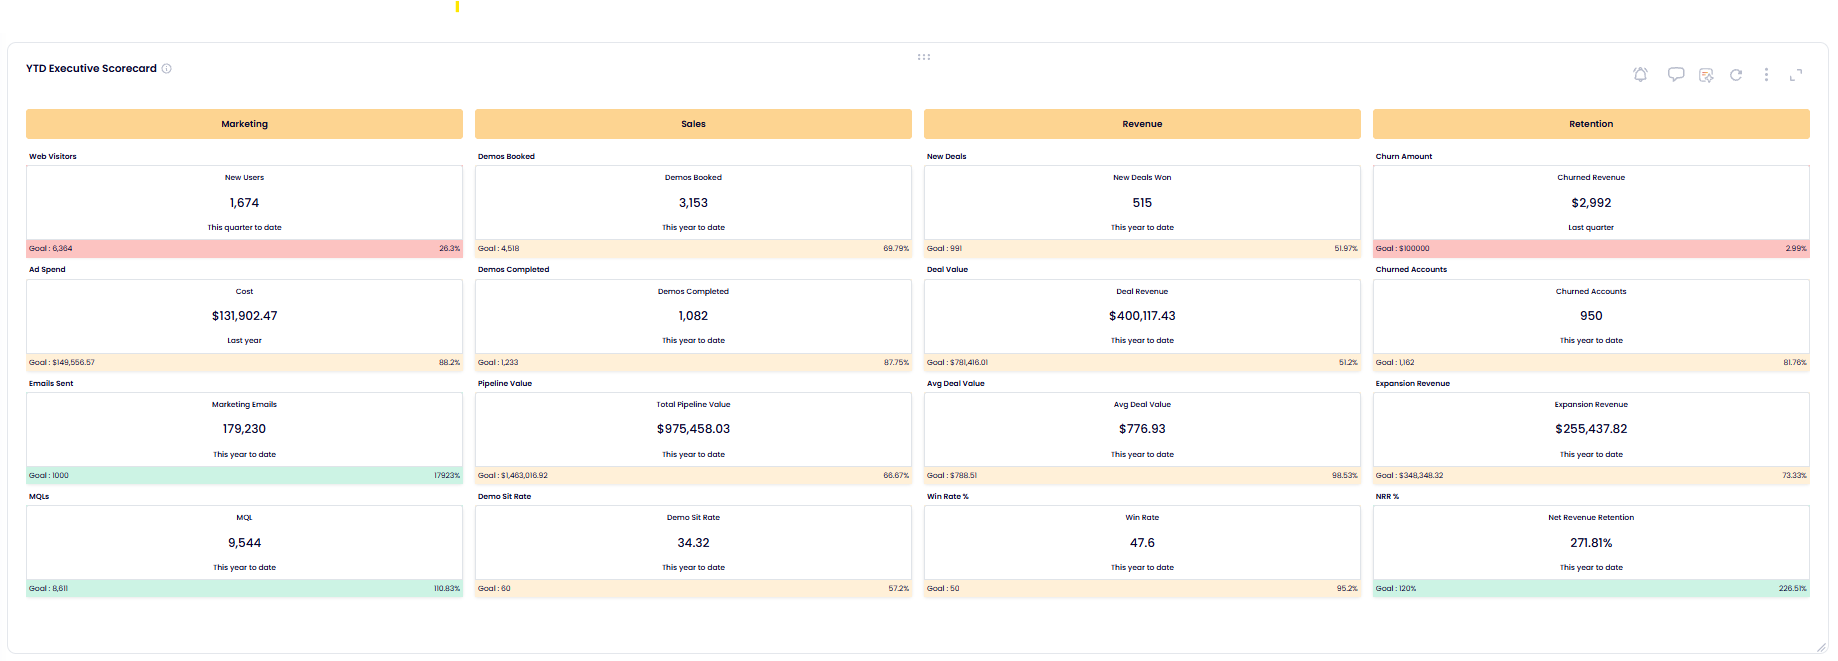
What it is
A high-level snapshot of performance across marketing, sales, revenue, and retention, compared against defined goals. It includes metrics like new users, MQLs, demos booked, pipeline value, win rate, and expansion revenue, all in one place.
Why it matters
- Helps you identify which functions are on track and which are lagging
- Surfaces problems early by comparing goals vs. actuals at a glance
- Reduces time spent collecting updates across departments
How GTM leaders can use it
Start your week or month here. Use this report to prioritize team reviews, allocate resources, and escalate issues with data backing. If something is off, this is where you’ll catch it first.
2. Pipeline Forecast Chart
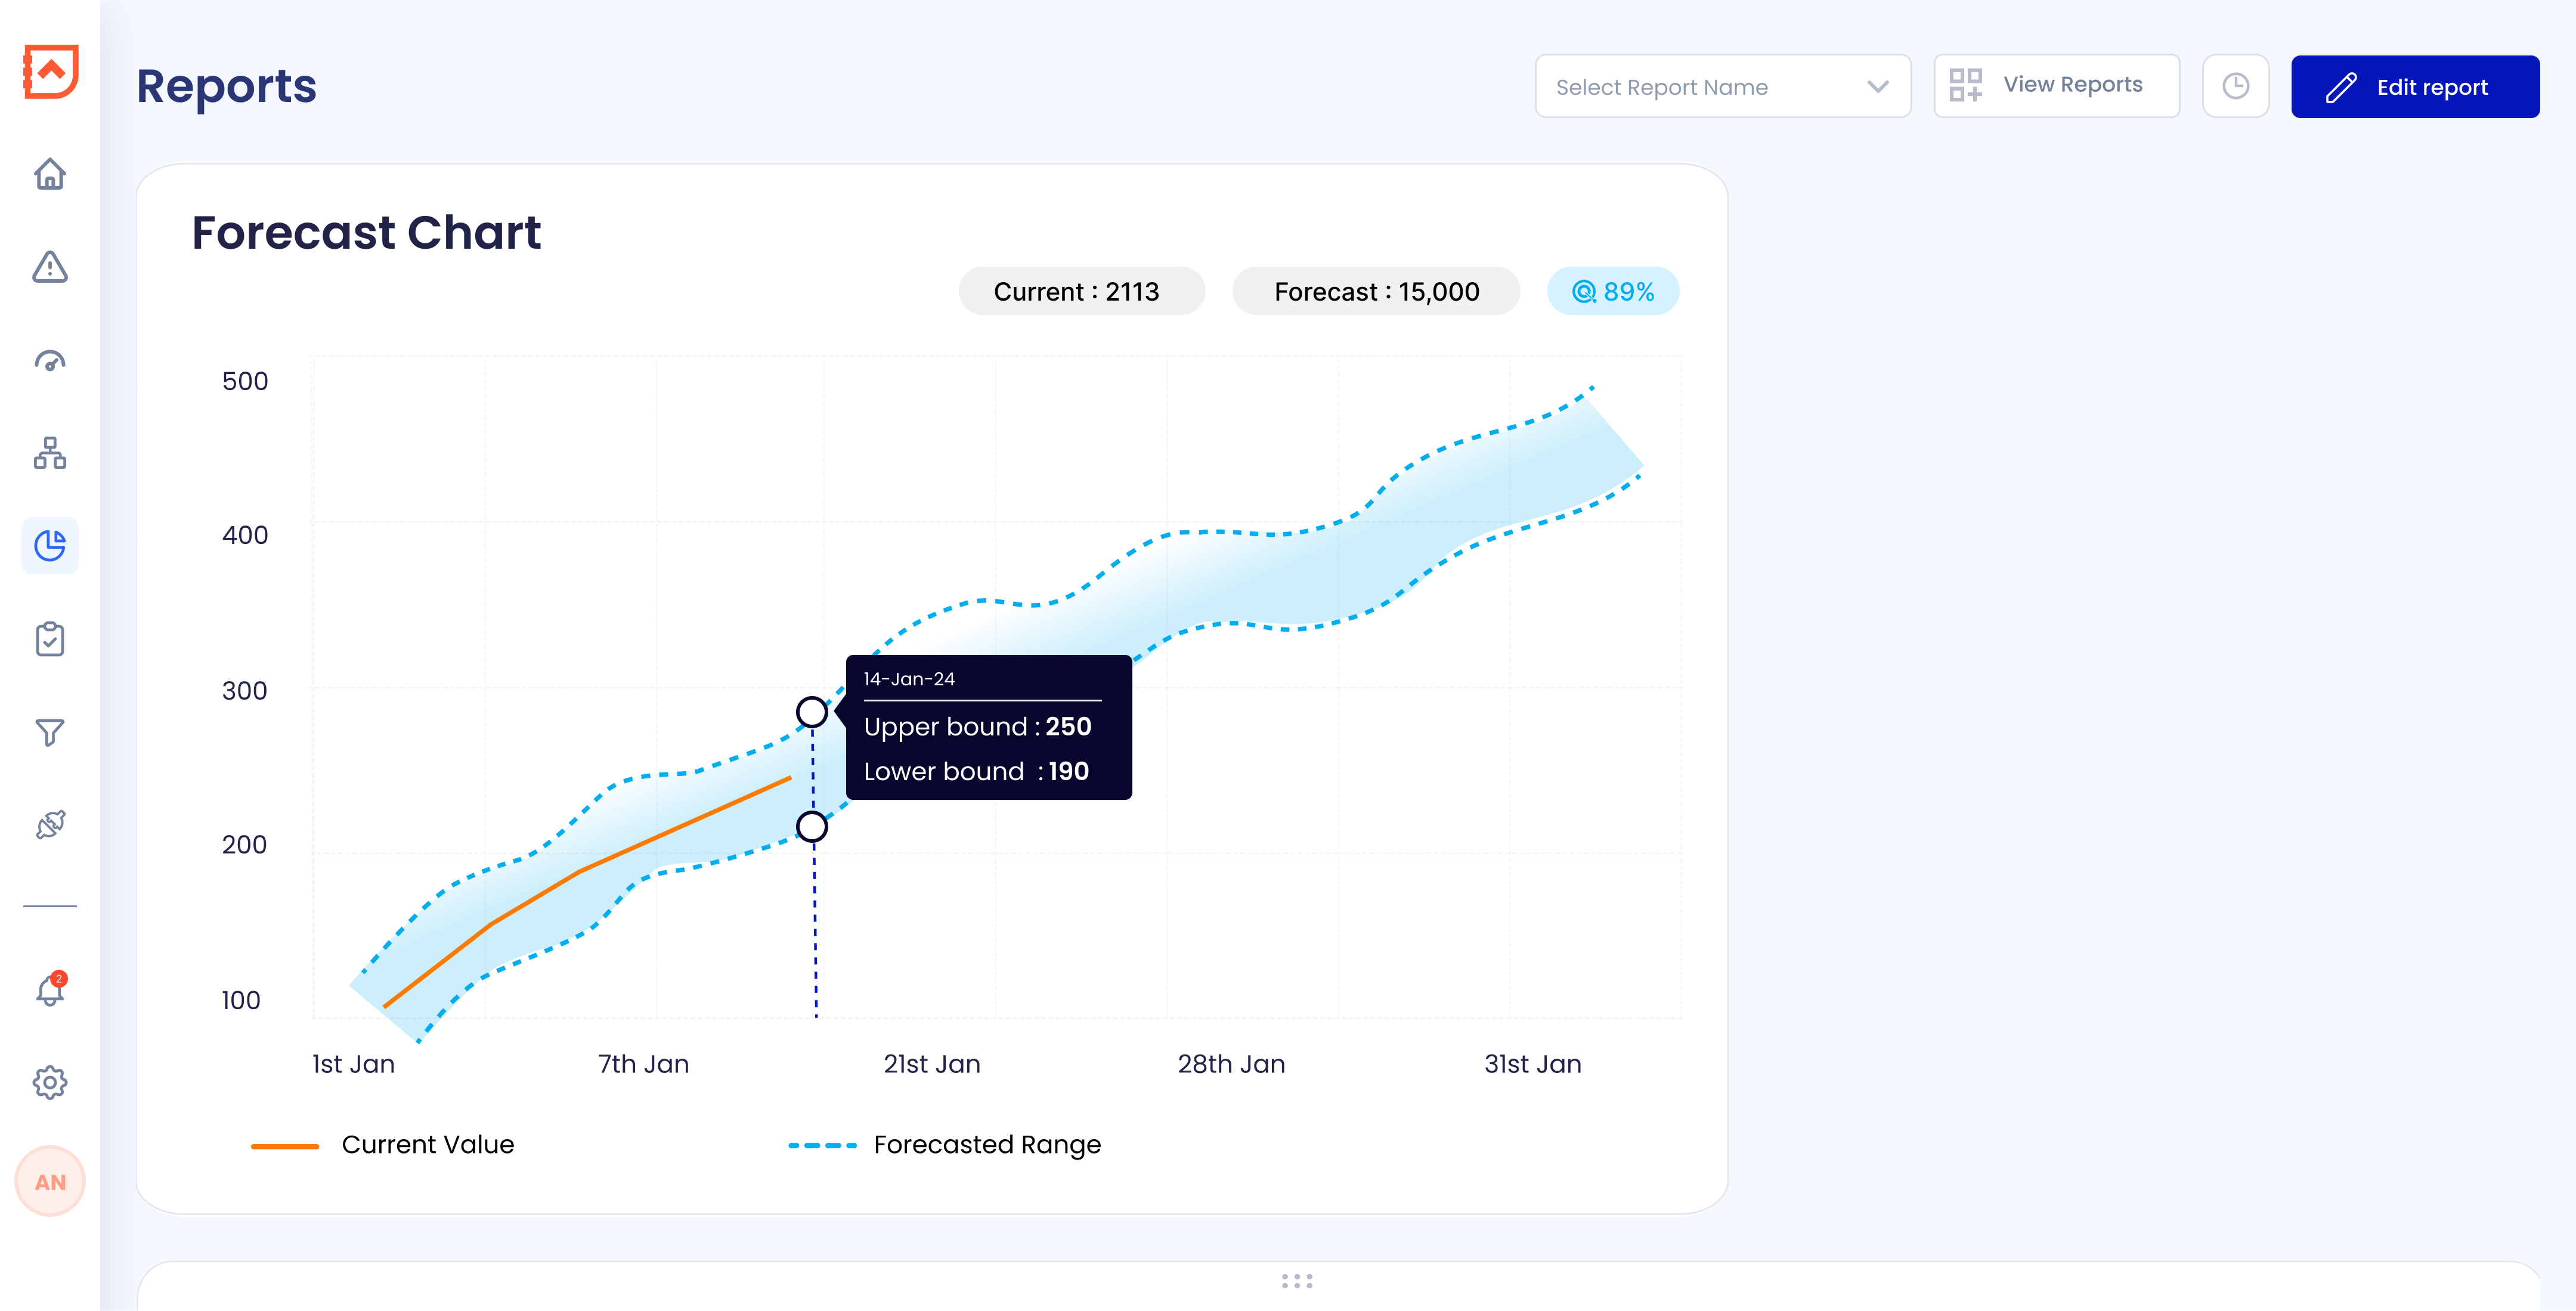
What it is
A visual projection of future pipeline value using current deals and historical trends. The chart includes a forecast range with upper and lower bounds, giving a realistic window of possible outcomes.
Why it matters
- Makes it easy to compare current performance vs. expected outcomes
- Prevents last-minute surprises by spotting shortfalls early
- Helps plan hiring, campaign pushes, and budget reallocations
How GTM leaders can use it
Use this during your forecasting meetings to understand whether you're trending above or below target. Adjust GTM plans based on how the forecast is shifting and use the confidence bands to plan best-case and worst-case scenarios.
3. Marketing Bowtie Funnel
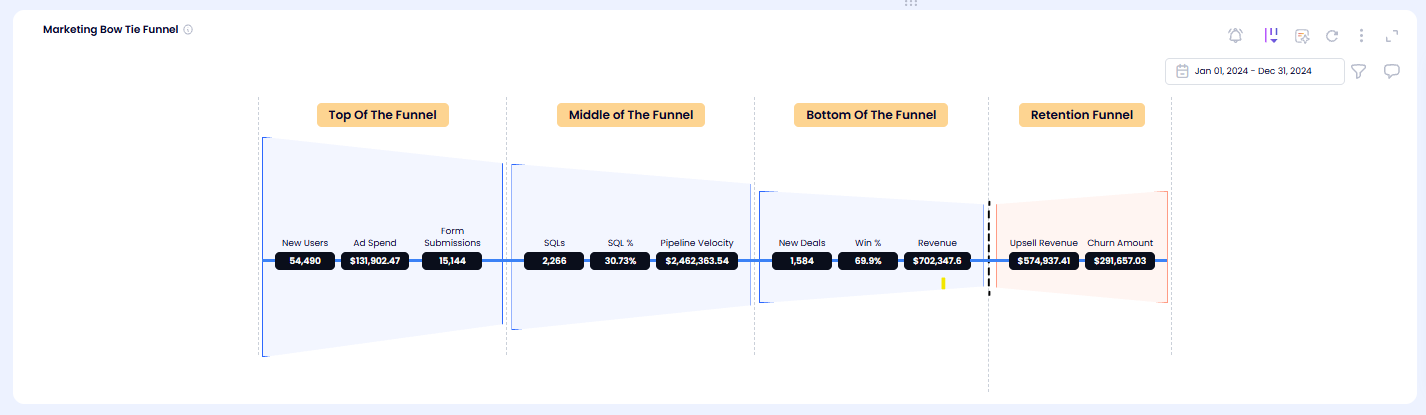
What it is
A full-funnel view that maps the journey from new users and form fills to SQLs, deals, expansion revenue, and churn. It shows both pre-sale and post-sale impact.
Why it matters
- Connects lead generation to actual revenue outcomes
- Highlights conversion drop-offs across any stage
- Helps align marketing and sales with one shared funnel
How GTM leaders can use it
Run cross-functional reviews with this report. If SQLs are converting well but revenue is flat, check your bottom-of-funnel. If pipeline velocity is high but expansion revenue is weak, revisit customer lifecycle programs. This report shows exactly where alignment breaks down.
4. SDR Activity Report
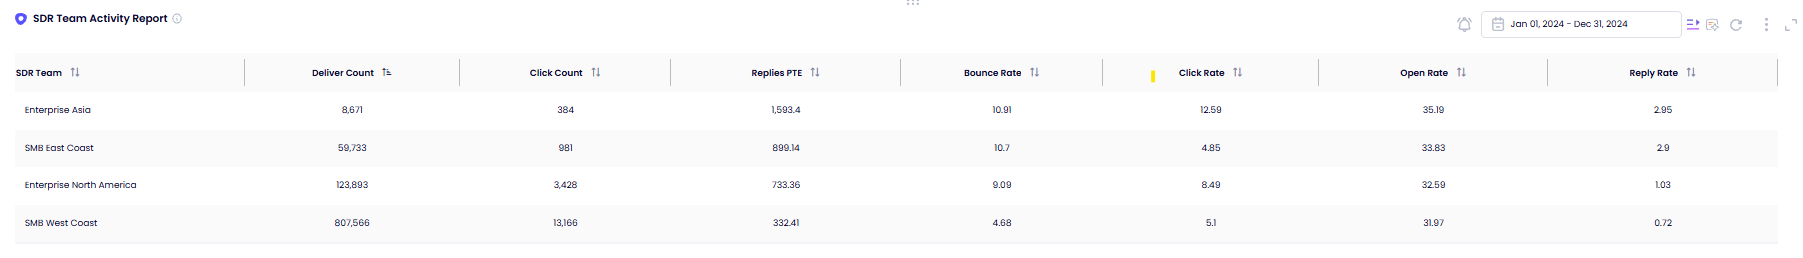
What it is
A team-level report showing SDR performance across emails sent, click rates, reply rates, bounce rates, and demos booked.
Why it matters
- Helps identify high-performing SDRs and underperforming regions
- Diagnoses issues in targeting, messaging, or data quality
- Gives early visibility into pipeline-building efforts
How GTM leaders can use it
Use this to coach reps and improve SDR output. For example, if reply rates are low despite high email volume, you may need to revisit sequences or targeting criteria. If bounce rates are high, clean up your data sources. This is your early indicator of pipeline health.
5. Trend: Demos to Deals
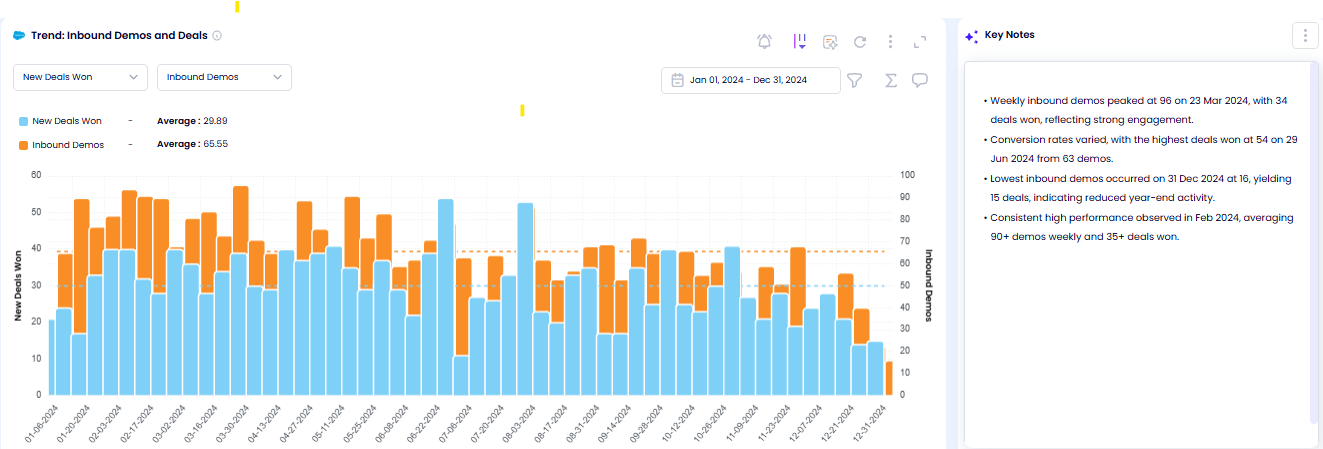
What it is
A time-series chart that compares how many demos were booked vs. how many deals were won each month. It reveals conversion patterns over time.
Why it matters
- Tracks whether demos are leading to actual revenue
- Highlights quality of leads and effectiveness of sales follow-up
- Shows changes in conversion velocity before they affect revenue
How GTM leaders can use it
Monitor this monthly to see if increased demo volume is translating into results. If deals are flat but demos are up, something is broken post-demo. If both are dropping, look upstream. It helps you act before revenue takes a hit.
6. Marketing Revenue by Source
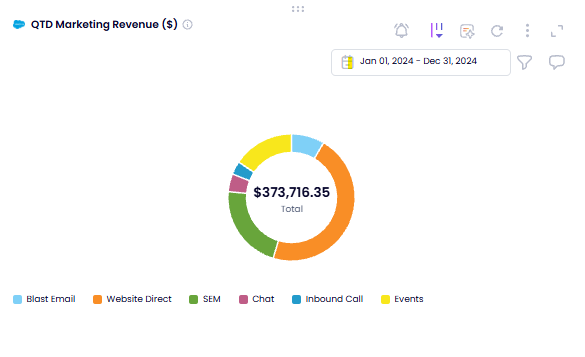
What it is
A revenue attribution chart that shows how much revenue each marketing channel (email, website, SEM, events, chat, etc.) actually contributed.
Why it matters
- Proves which campaigns and channels drive real pipeline
- Helps justify or adjust budget based on performance
- Prioritizes high-impact programs over high-volume ones
How GTM leaders can use it
Use this when presenting to finance or during quarterly planning. If SEM generated high revenue but low lead volume, it’s still worth investing in. If a high-cost channel is not converting to revenue, you’ll have data to back a shift in spend.
Final Thoughts
The difference between a reactive GTM team and a high-performing one usually comes down to visibility. These six reports give you that visibility. They eliminate second-guessing, align every function, and let you lead with clarity.
Each one has a specific role:
- The Executive Scorecard shows where you stand
- The Forecast Chart shows where you're headed
- The Bowtie Funnel shows how your funnel really performs
- The SDR Report shows where pipeline is being created or blocked
- The Demos-to-Deals Trend shows conversion velocity
- The Channel Revenue Report shows where to double down
Want help setting up reports that actually get used?
Book a demo and see how Revlitix gives you clarity without the chaos.


