Revlitix Reporting

Demo Source Breakdown

Persona
Head of Marketing
VP Sales
Revenue Operations
Demand Generation
SDR Manager
Donut Chart
What it is?

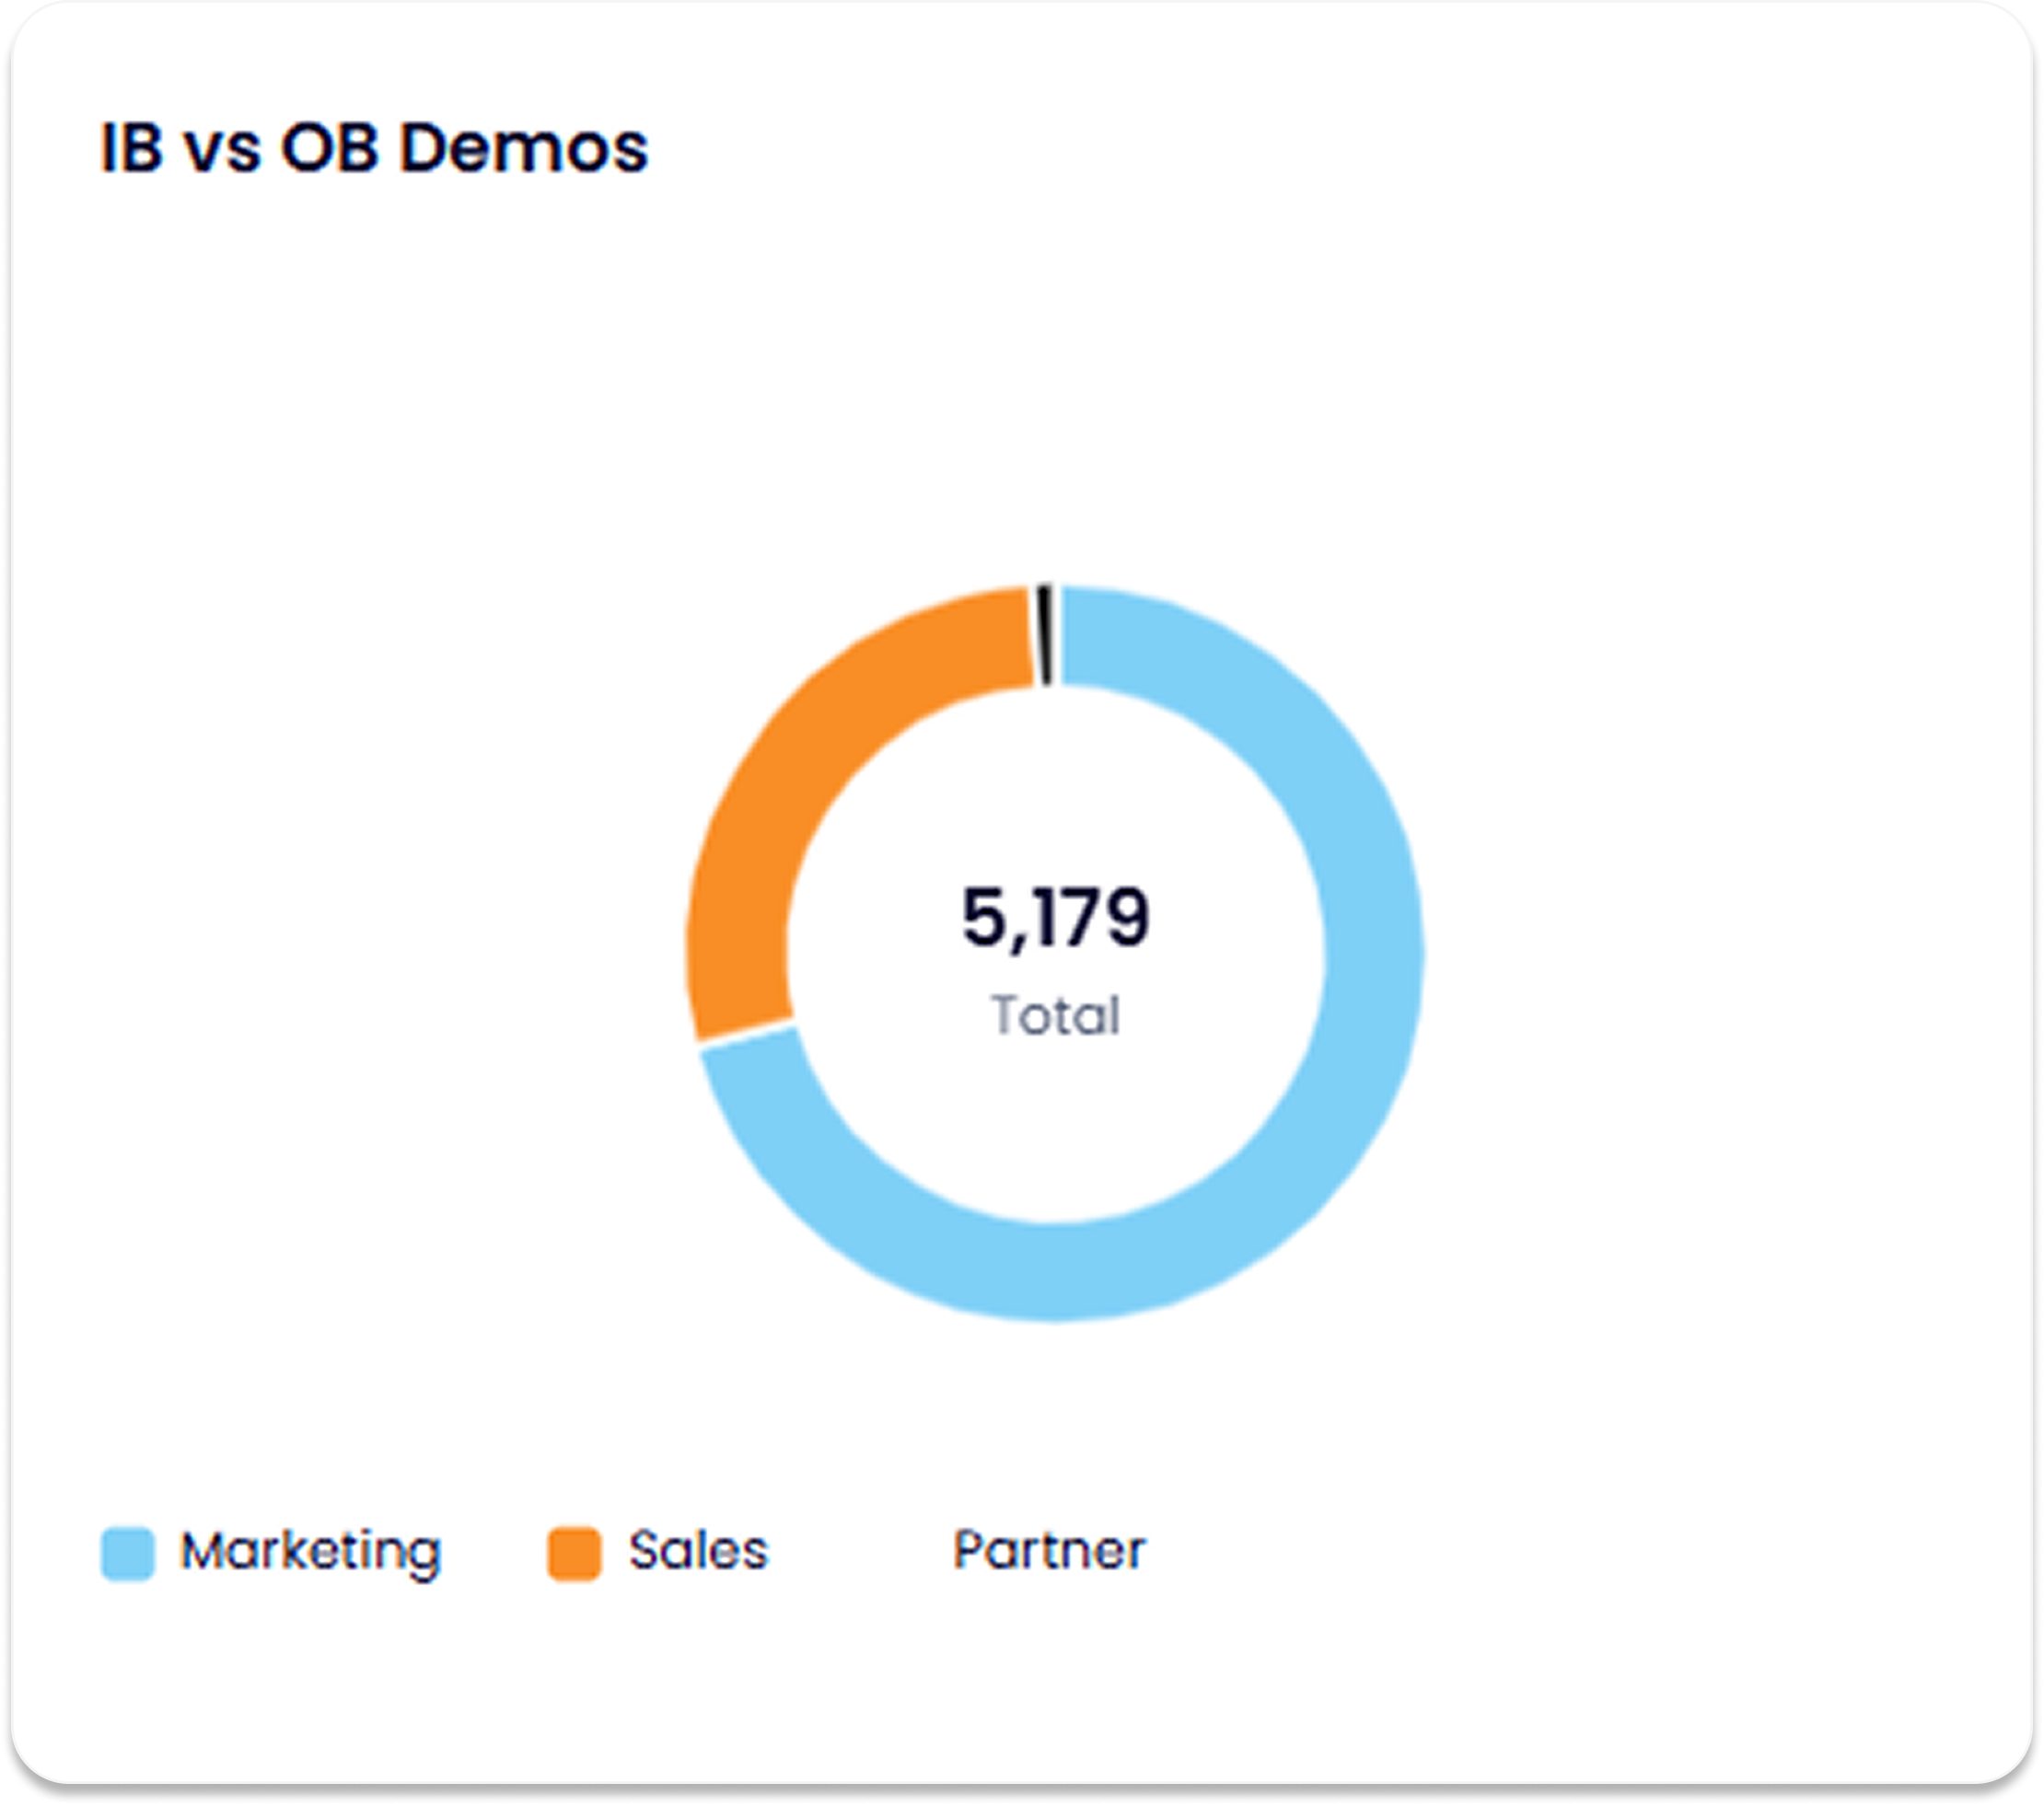
This report uses a donut chart to show the total number of demos booked, categorized by their source. The three segments include:

  • Marketing (Inbound): Demos triggered by website forms, paid campaigns, webinars, or other inbound efforts.
  • Sales (Outbound): Demos generated by SDR outreach such as emails, calls, or LinkedIn prospecting.
  • Partner: Demos attributed to channel partners or referral programs.

The center of the chart displays the total demo count, while the segments show the proportion each source contributes.

Why it matters?

This report provides a clear view of how different motions are contributing to pipeline generation. It allows teams to:

  • Understand which team or channel is driving demo volume
  • Identify imbalances in pipeline sourcing before they affect revenue
  • Shift focus or resources if one motion is lagging behind
  • Foster accountability across Sales, Marketing, and Partnerships

For example, if inbound is contributing most of the demos, but sales outbound contribution is low, the SDR manager might need to review sequences or improve targeting. If partner-driven demos are consistently low, the partnerships team can investigate whether enablement materials or incentives need improvement.

See Your GTM Story in One Dashboard

Revlitix brings all your GTM data together so you can build reports fast, spot insights easily, and stay ahead without spreadsheet chaos.