
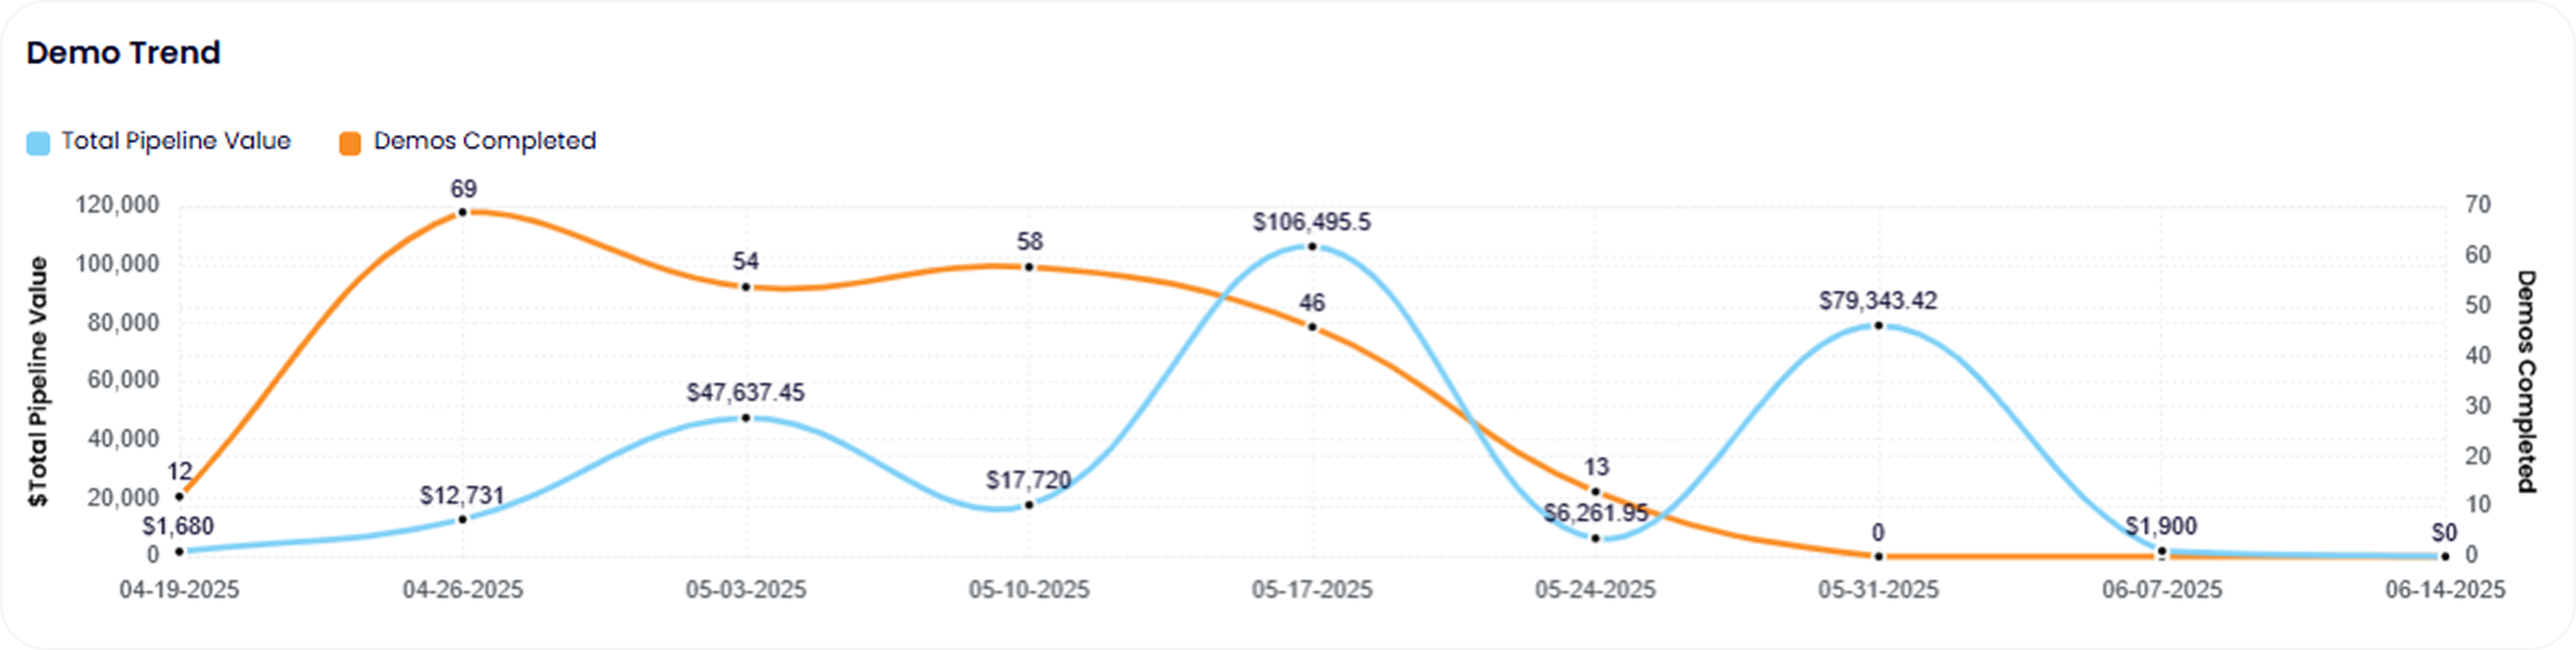
What it is?
A time-series report plotting two metrics: the number of demos completed and the total pipeline value associated with those demos. It displays week-by-week trends, making it easy to spot correlations or divergences between demo activity and revenue potential.


