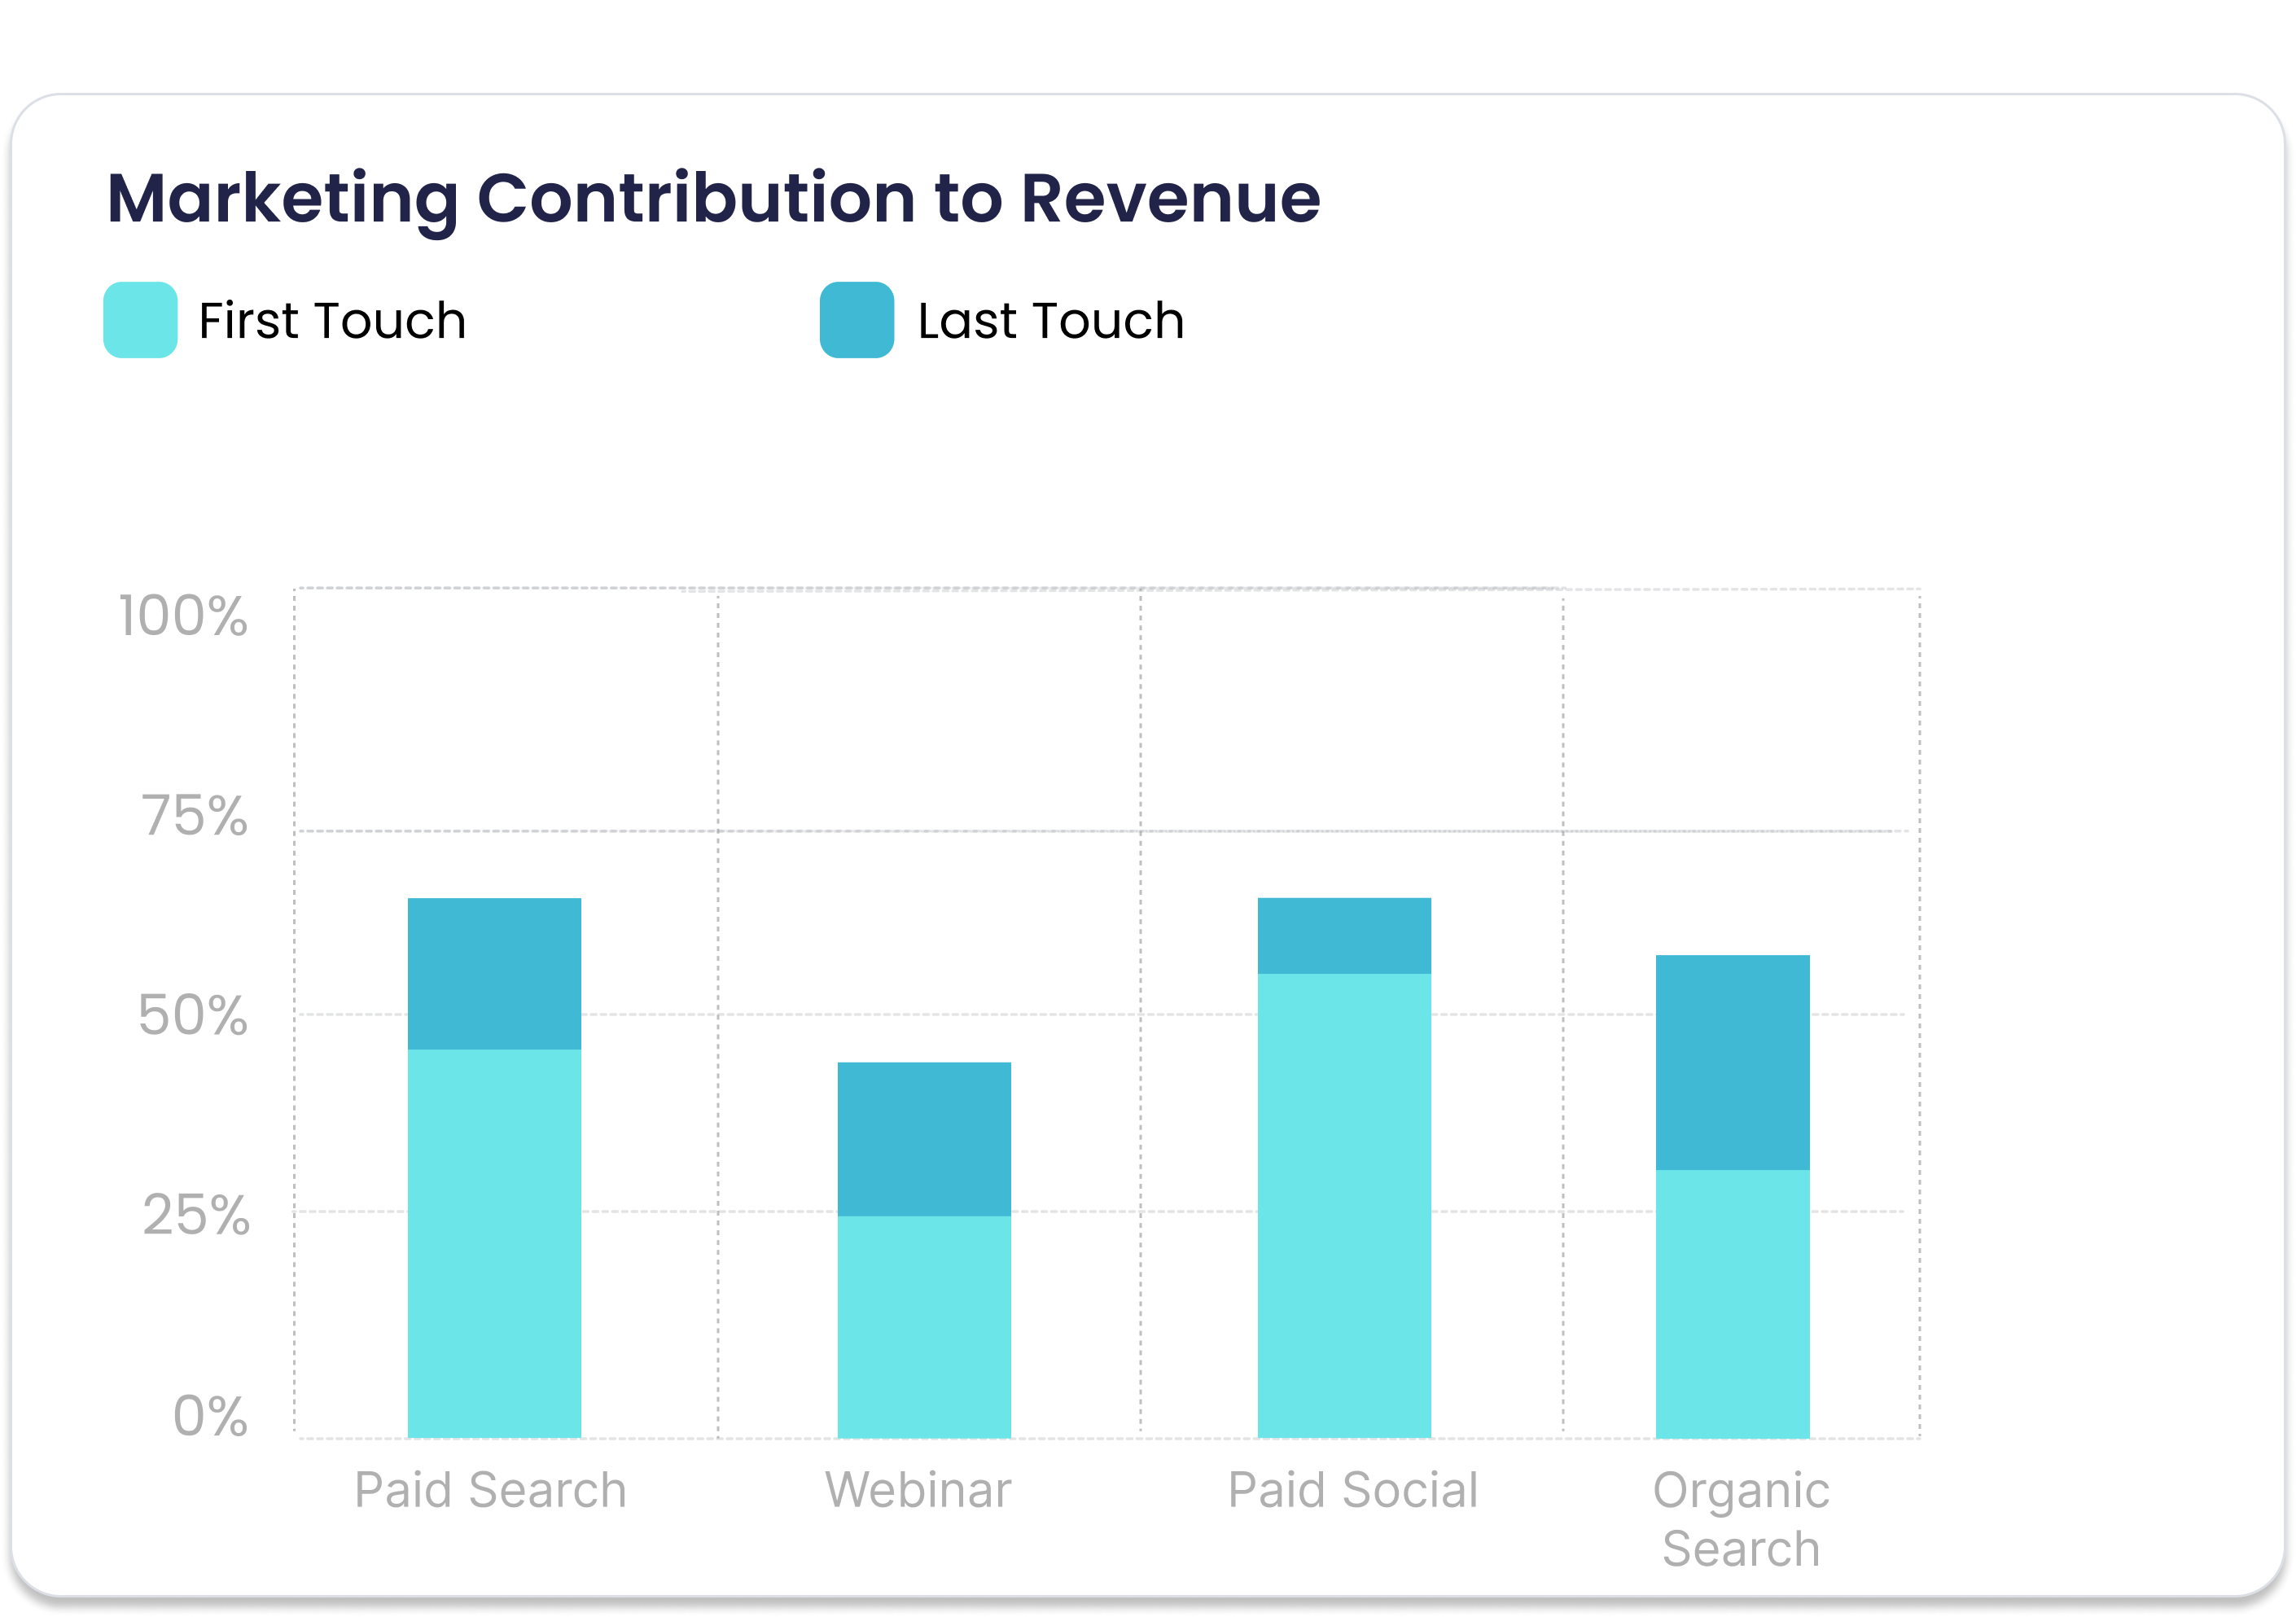
Revlitix Reporting

First vs Last Touch Attribution

Persona
CMO
Head of Marketing
Demand Generation
Marketing Operations
Revenue Operations
Bar Chart
What it is?

A bar chart comparing how different marketing channels contribute to revenue at two critical points in the customer journey: the first touch (the channel that initially attracted the lead) and the last touch (the channel that directly influenced the deal closure). Channels displayed include Paid Search, Webinar, Paid Social, and Organic Search, with bars showing the percentage contribution of each stage to total revenue.

Why it matters?

This report is essential for marketing and revenue leaders because it:

  • Highlights channels that excel at creating awareness versus those that help close deals
  • Helps avoid overvaluing or undervaluing channels by revealing their true influence across the funnel
  • Informs smarter budget allocation between top-of-funnel and bottom-of-funnel activities
  • Guides the development of a more accurate multi-touch attribution model for revenue reporting
  • Supports leadership discussions with data that connects marketing efforts directly to pipeline and revenue impact

By distinguishing between acquisition and conversion roles, this report ensures marketing teams can build strategies that maximize both lead volume and deal closure rates.

See Your GTM Story in One Dashboard

Revlitix brings all your GTM data together so you can build reports fast, spot insights easily, and stay ahead without spreadsheet chaos.