Revlitix Reporting

Marketing Bow Tie: From Spend to Retention

Persona
Head of Marketing
CMO
VP Marketing
Demand Generation
Revenue Operations
Lifecycle Marketing Manager
Bow Tie Chart
What it is?

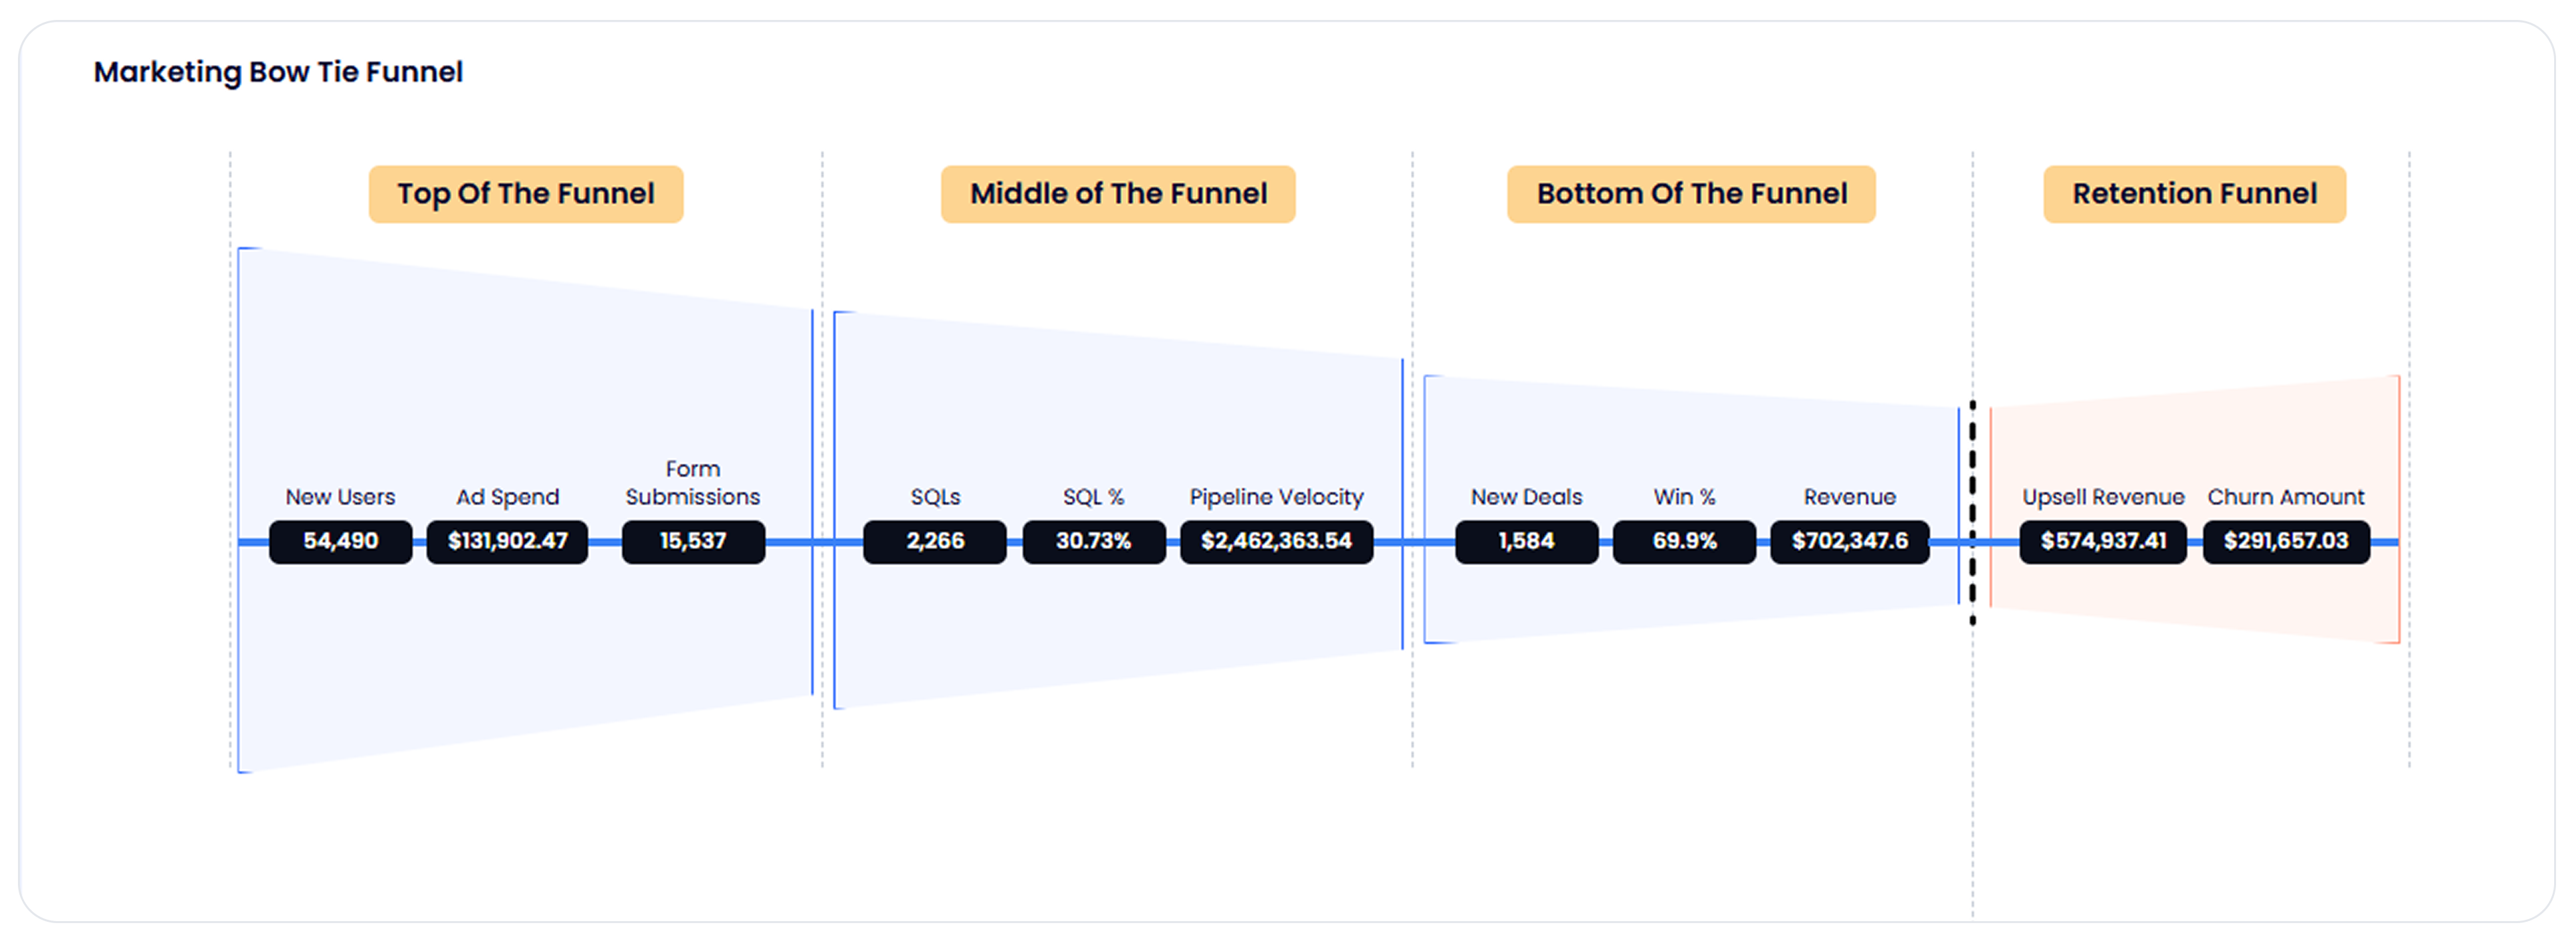
A comprehensive visual report that maps the entire marketing funnel from first touch to revenue and retention.
It captures key stages and metrics across the buyer journey, including New Users, Ad Spend, Form Submissions, SQLs, SQL Conversion Rate, Pipeline Velocity, Win Rate, Revenue, Upsell Revenue, and Churn. This bow tie view brings together top-of-funnel acquisition and customer outcomes in one unified view.

Why it matters?

Most reporting stops at pipeline or closed-won revenue. This report goes further.
It shows how well your GTM engine is performing at each stage—whether your ad dollars are converting to SQLs, how fast deals are moving, and what’s happening after the deal closes.

It helps teams:

  • Pinpoint where prospects are dropping off in the journey
  • Identify conversion and velocity bottlenecks
  • Measure how acquisition efforts impact long-term revenue and churn
  • Align marketing, sales, and customer success with shared funnel visibility

This is the go-to report for understanding both efficiency and sustainability across your entire GTM motion.

See Your GTM Story in One Dashboard

Revlitix brings all your GTM data together so you can build reports fast, spot insights easily, and stay ahead without spreadsheet chaos.