Revlitix Reporting

Marketing Performance by Territory

Persona
CMO
Head of Marketing
Demand Generation
Revenue Operations
VP Sales
GTM Leadership
Funnel Breakdown Chart
What it is?

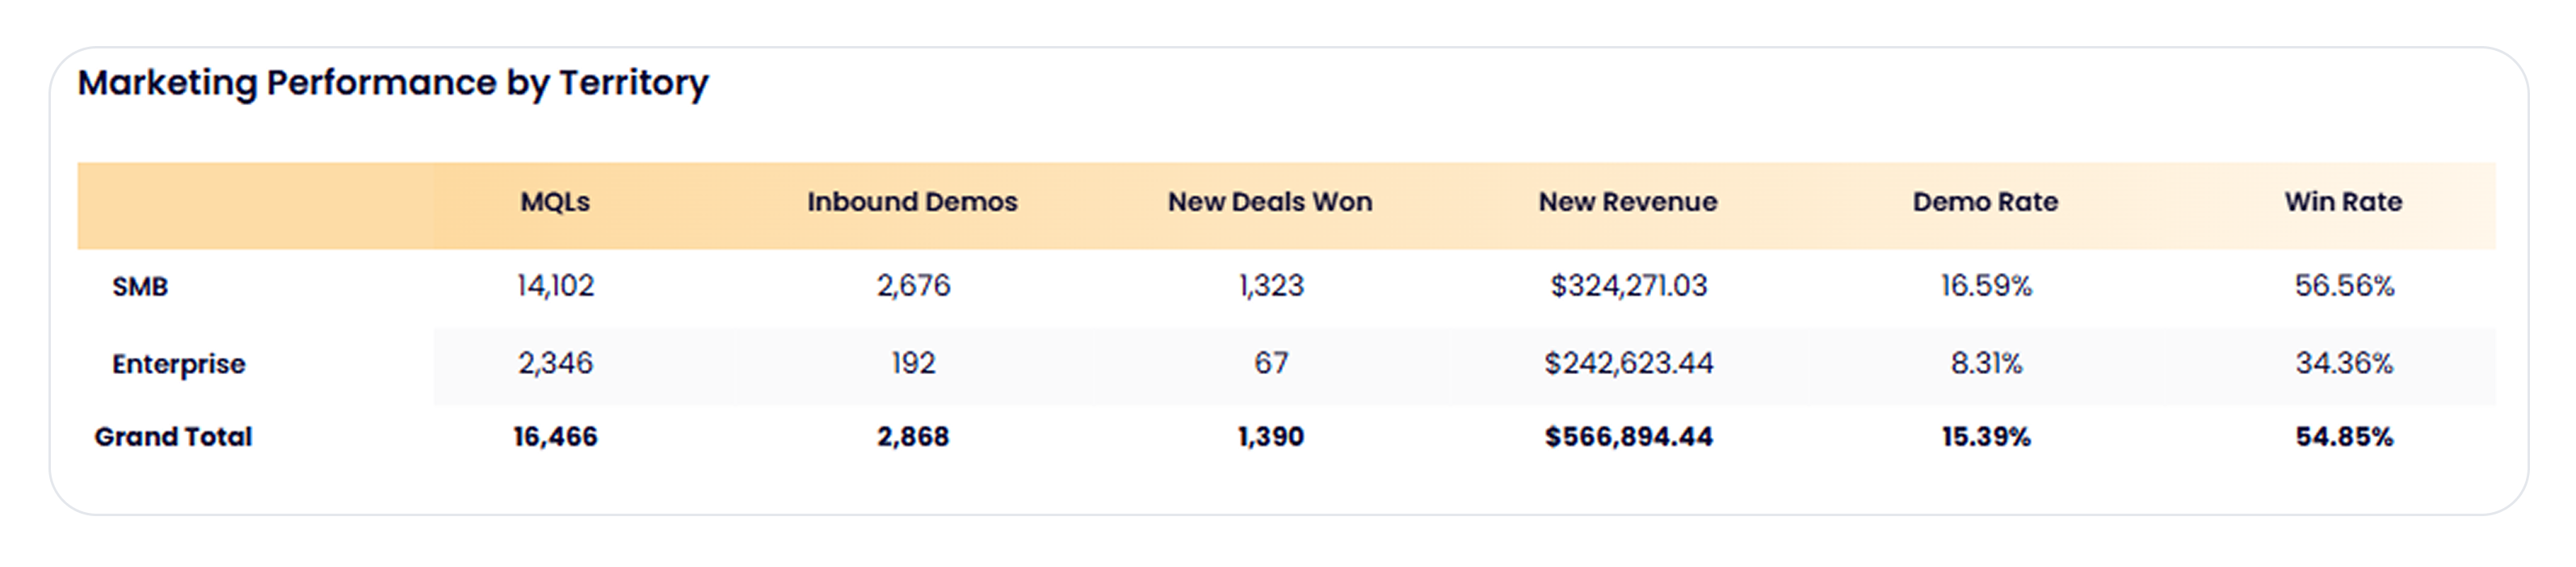
A performance report that compares key funnel metrics—MQLs, Inbound Demos, Deals Won, Revenue, Demo Rate, and Win Rate—across different customer segments or territories

Why it matters?

Most marketing teams don’t just generate leads—they have to generate the right leads. This report helps GTM teams move from surface-level metrics to real business impact by providing clarity on segment-level efficiency and contribution.

Here’s how it helps:

  • Compare GTM Performance by Segment: See which territories (SMB, Enterprise, etc.) convert better across the funnel—where MQLs are turning into demos, and demos into revenue.
  • Spot Drop-offs and Inefficiencies: A low demo or win rate signals poor fit or broken messaging in a segment. For example, if Enterprise has a low demo rate despite healthy MQL volume, the problem may lie in qualification or outreach strategy.
  • Align Sales and Marketing: Both teams can see the same funnel metrics and diagnose where things are stalling—whether it’s bad MQL quality or poor demo follow-ups.
  • Inform Budgeting and Campaign Focus: Invest more in high-efficiency segments. If SMB generates more revenue at a higher win rate, it’s a case for doubling down.
  • Drive ICP Refinement: Use this data to adjust your ideal customer profile and fine-tune targeting by industry, size, or territory.

It’s not just about counting leads—it’s about seeing how every territory contributes to pipeline and revenue.

See Your GTM Story in One Dashboard

Revlitix brings all your GTM data together so you can build reports fast, spot insights easily, and stay ahead without spreadsheet chaos.