Revlitix Reporting

Monthly Funnel Metrics Overview

Persona
VP Marketing
Marketing Operations
Revenue Operations
CEO
CRO
VP Sales
Demand Generation
Funnel Overview Chart
What it is?

A month-over-month performance summary across the full GTM funnel.
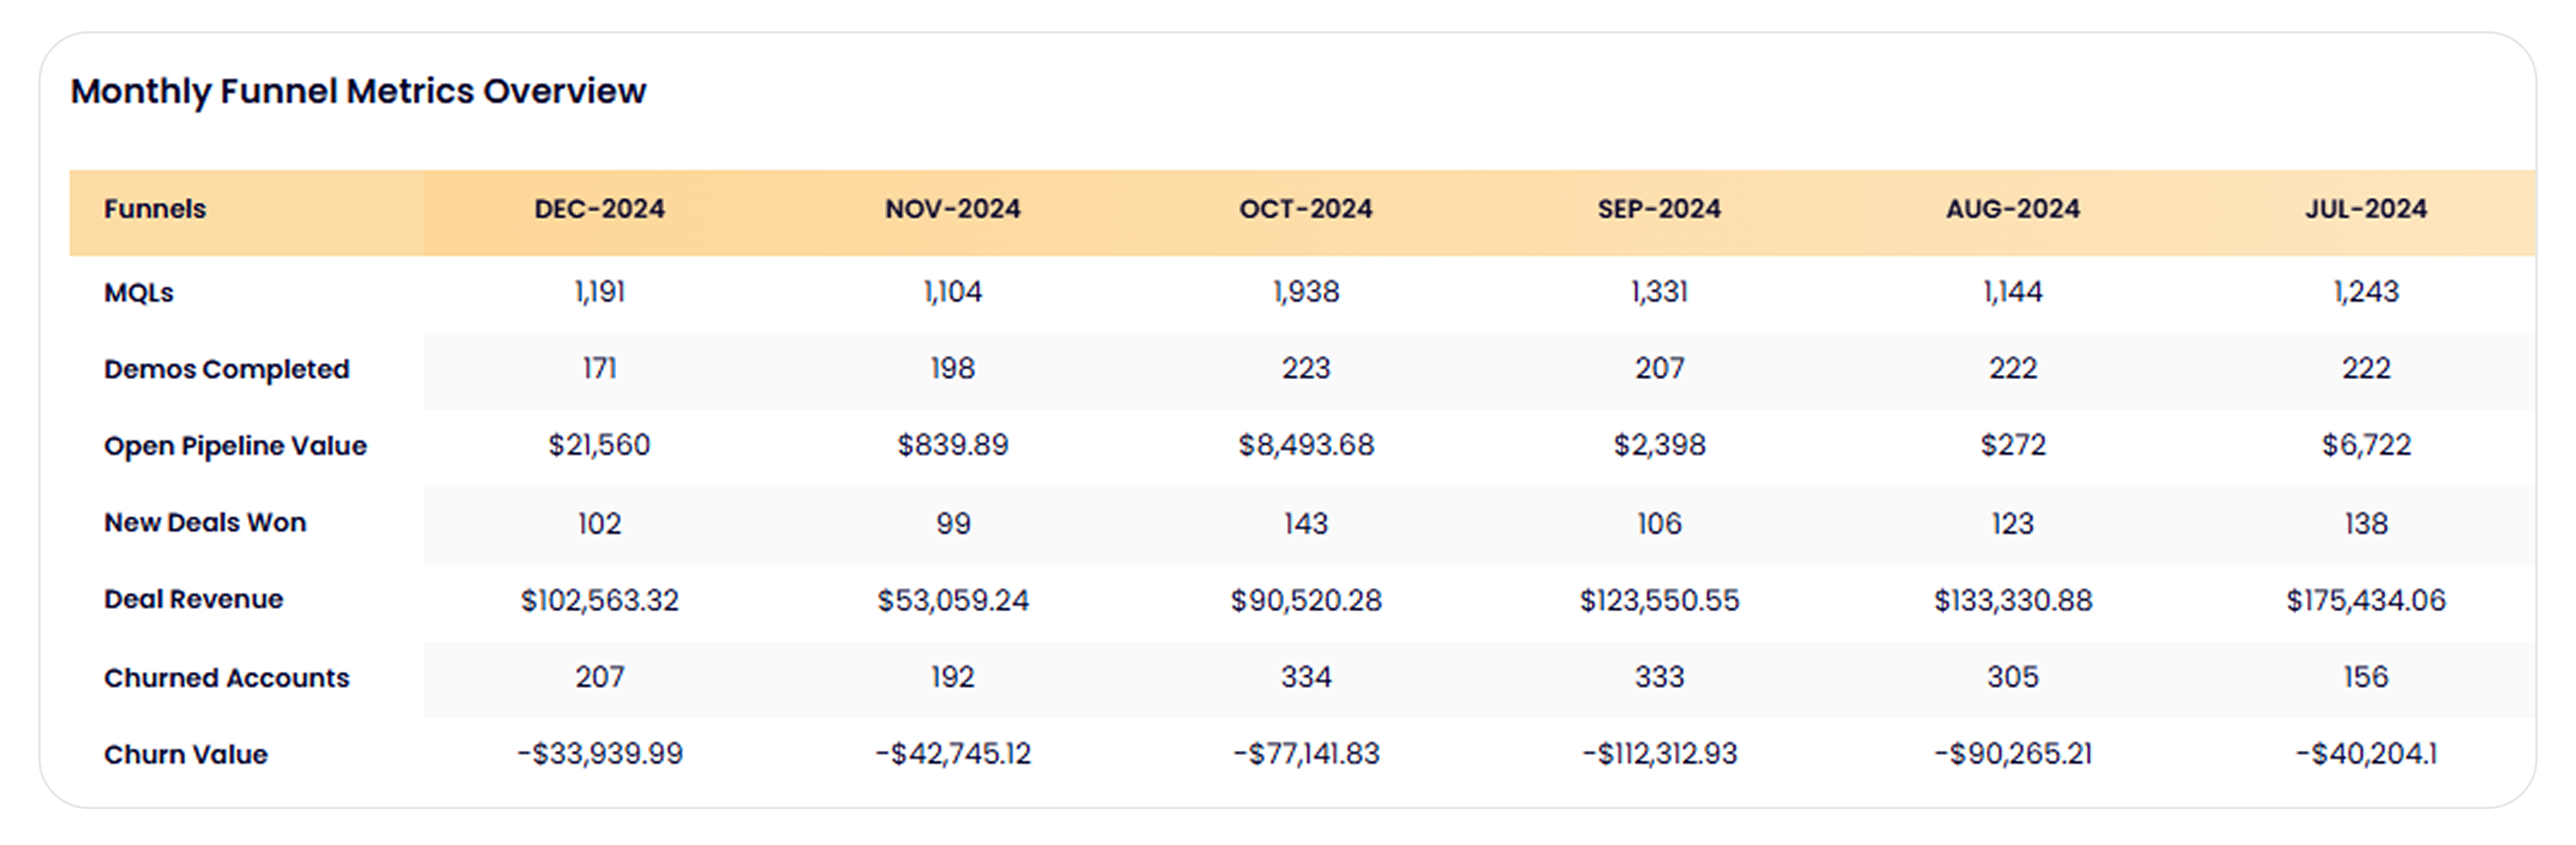
This report tracks key funnel metrics including MQLs, Demos Completed, Open Pipeline Value, New Deals Won, Deal Revenue, Churned Accounts, and Churn Value. It provides a clear view of how top-of-funnel and post-sale metrics are trending over time, making it easy to compare growth, gaps, and churn in one place.

Why it matters?

Most teams track performance in silos. This report connects marketing, sales, and retention metrics into a unified monthly view.

It helps GTM leaders:

  • Spot drop-offs or surges in pipeline and revenue
  • Correlate MQLs and demo volume with actual deal wins
  • Understand revenue gained versus revenue lost through churn
  • Identify which months drove real momentum and which need attention
  • Plan future campaigns and capacity based on pipeline trends

This report brings alignment between Marketing, Sales, and Customer Success by giving everyone the same view of funnel performance over time.

See Your GTM Story in One Dashboard

Revlitix brings all your GTM data together so you can build reports fast, spot insights easily, and stay ahead without spreadsheet chaos.