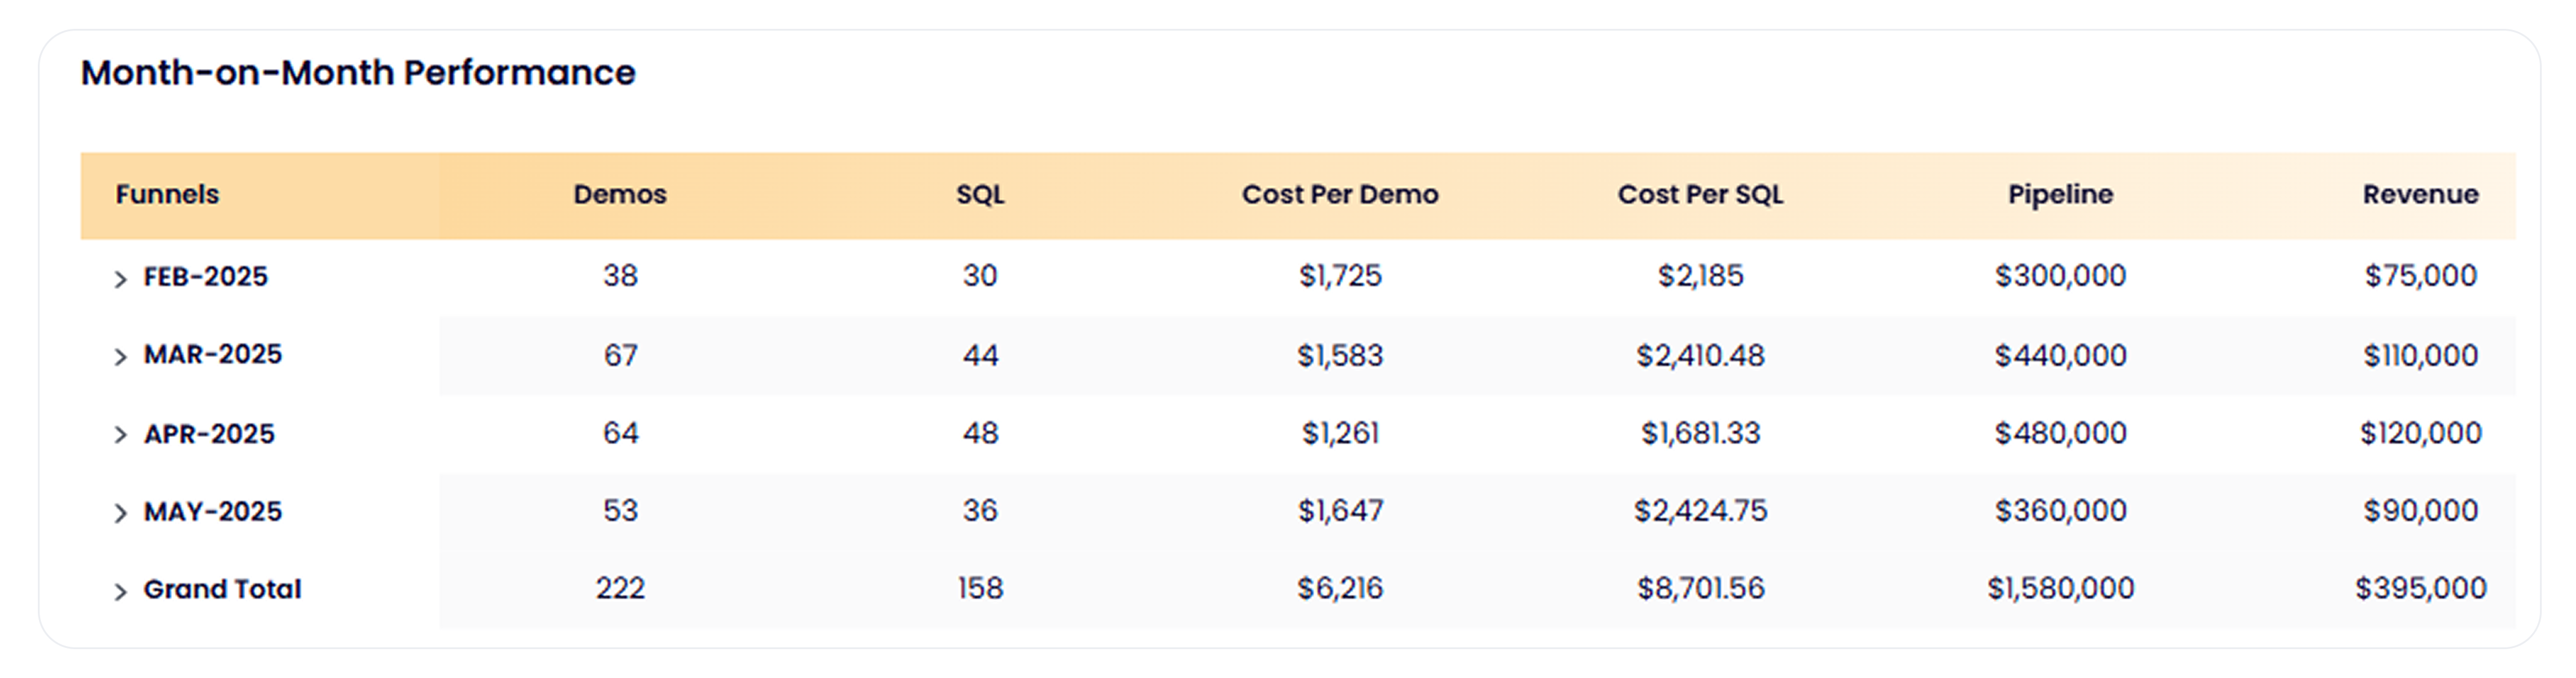
Revlitix Reporting

Monthly Funnel Performance Report

Persona
Head of Marketing
VP Marketing
Demand Generation
Revenue Operations
Marketing Operations
Funnel Overview Chart
What it is?

A trend report that tracks key funnel KPIs including demos, SQLs, cost per demo, cost per SQL, pipeline, and revenue, broken down month by month.
It provides a cumulative and granular view of how these metrics are changing over time, helping teams assess performance consistently.

Why it matters?

Performance doesn’t exist in a vacuum. This report gives the month-by-month context needed to spot momentum, stagnation, or early signs of decline at any stage of the funnel.

It helps teams:

  • Track how top-of-funnel activity converts into pipeline and revenue
  • Monitor changes in acquisition costs like CPL and cost per SQL
  • Identify which months were most efficient or underdelivered
  • Understand trends across the sales funnel to forecast better
  • Make timely adjustments to campaigns, budgets, or team priorities

For marketing and RevOps leaders, this report acts as a health check that connects tactical activity with long-term growth goals.

See Your GTM Story in One Dashboard

Revlitix brings all your GTM data together so you can build reports fast, spot insights easily, and stay ahead without spreadsheet chaos.