What it is?
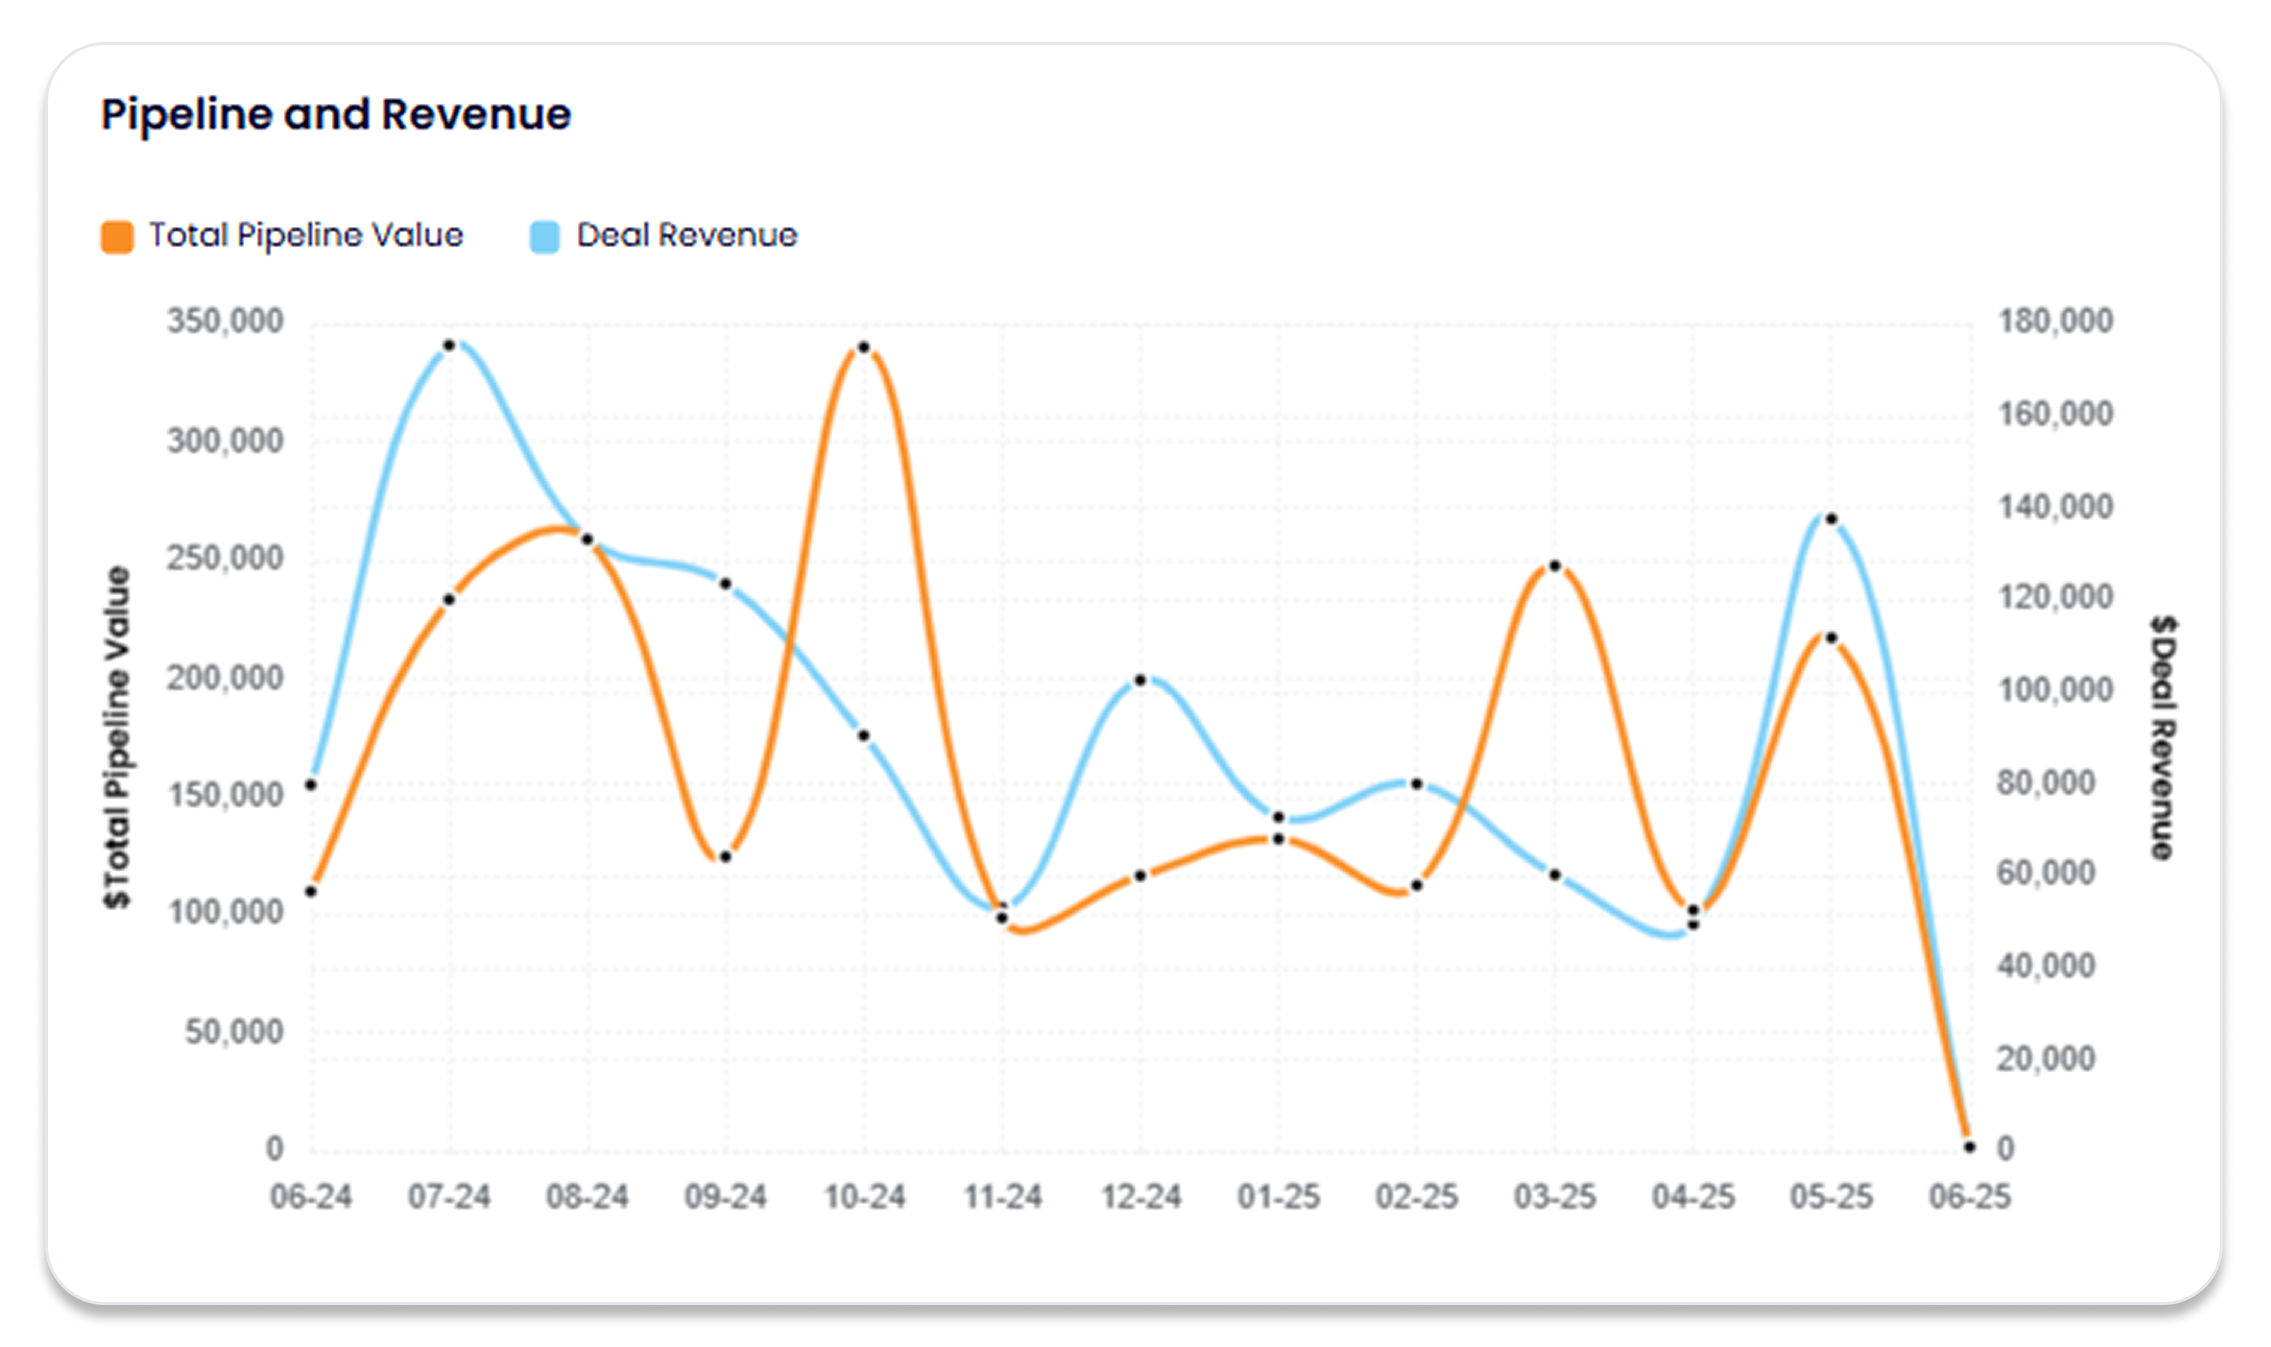
This time-series chart visualizes total pipeline value and closed-won revenue over a set period. It helps track whether pipeline generation efforts are converting into actual revenue and how efficiently the funnel is operating.

This time-series chart visualizes total pipeline value and closed-won revenue over a set period. It helps track whether pipeline generation efforts are converting into actual revenue and how efficiently the funnel is operating.
This report is critical for connecting marketing and revenue outcomes. It enables teams to:


