
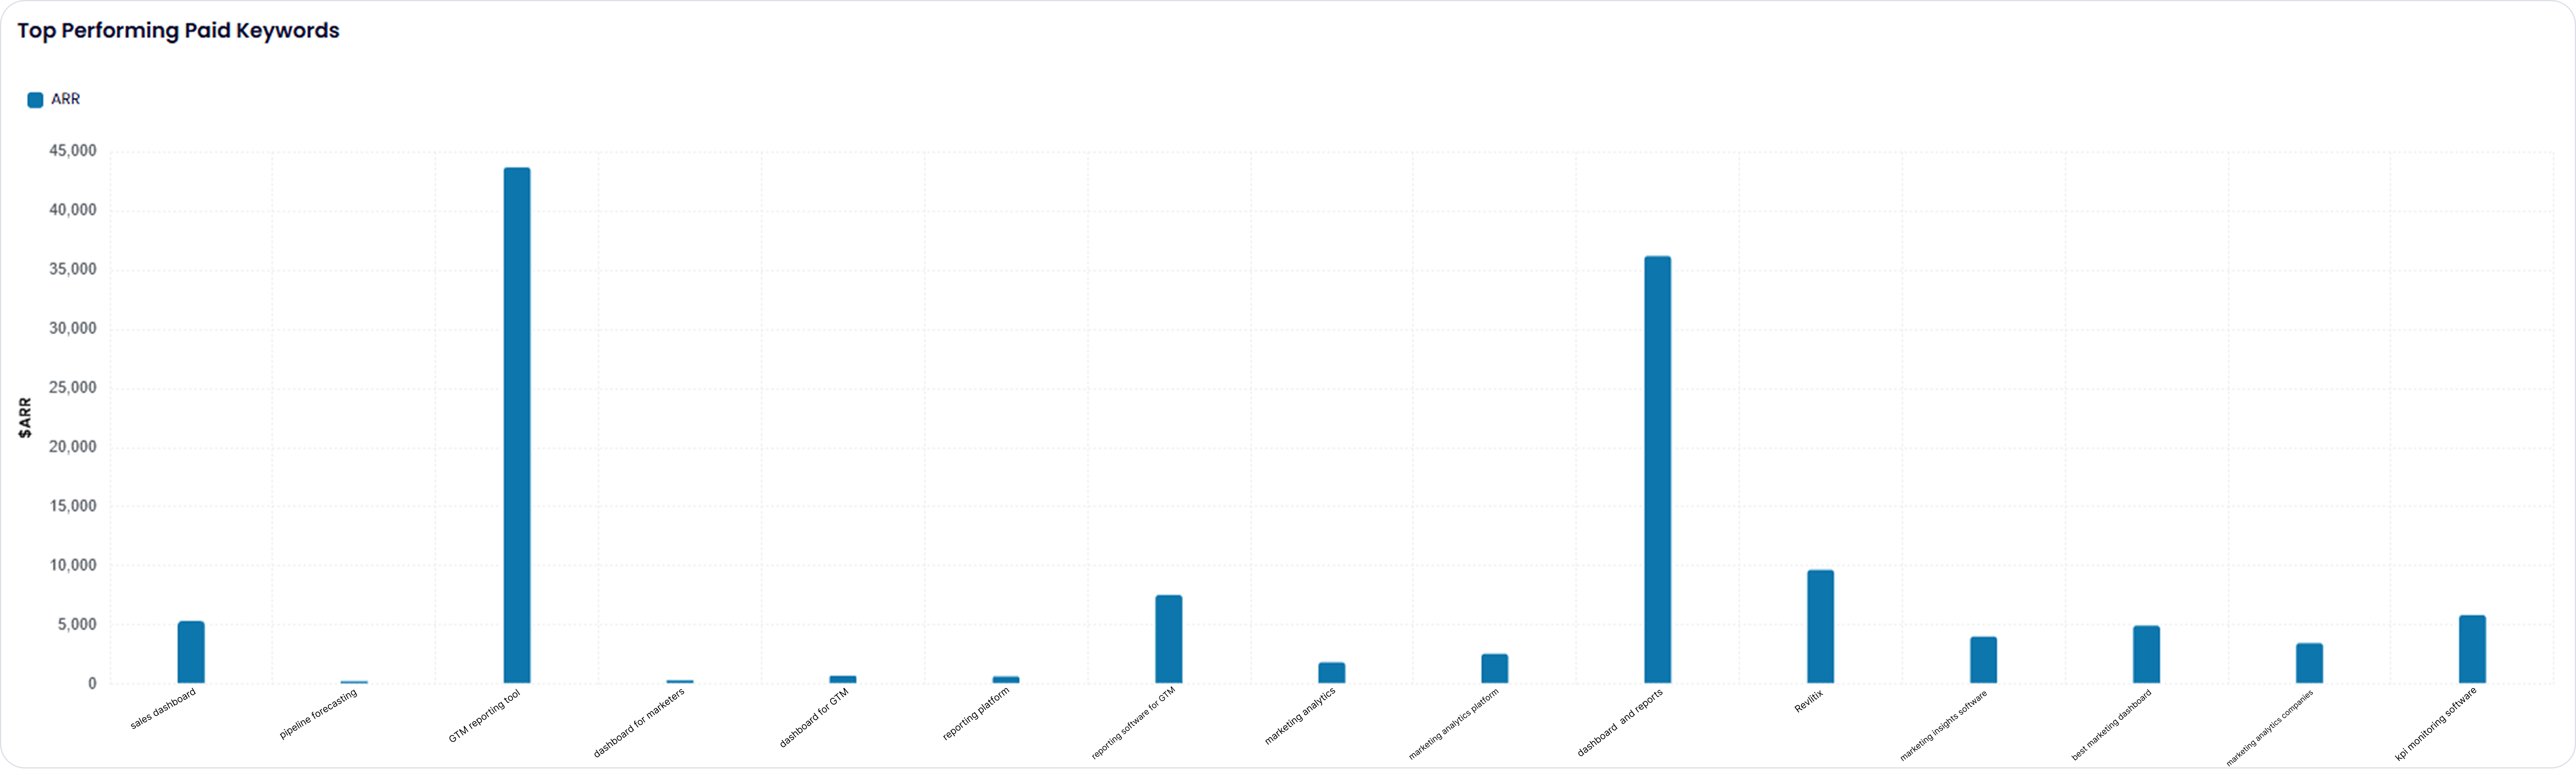
What it is?
A bar chart that ranks paid search keywords based on the Annual Recurring Revenue (ARR) they have influenced or generated. Keywords shown include examples such as “sales dashboard,” “pipeline forecasting,” “GTM reporting tool,” “marketing analytics,” and others. The report visualizes how much revenue each keyword drives, helping marketers see the direct value of their paid search investments.


